
Fig. 2
- ID
- ZDB-FIG-210324-31
- Publication
- Olguin-Olguin et al., 2021 - Chemokine-biased robust self-organizing polarization of migrating cells in vivo
- Other Figures
- All Figure Page
- Back to All Figure Page
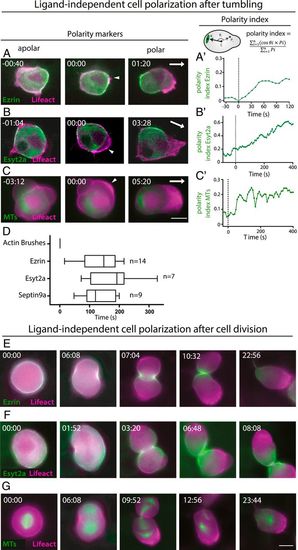
Steps of ligand independent self-organizing cell polarization. (A–C) The establishment of the cell rear in the absence of receptor signaling as determined by the distribution of (A) Ezrin, (B) Esyt2a, and (C) MTs (Clip170H) in green. The cell front is marked by Lifeact (magenta). Apolar tumbling cells (Left), the appearance of actin within the new cell front (time 00:00, Middle), and the localization of the proteins at the rear of the cell (Right) is presented. Times indicate minutes and seconds, before and after the establishment of the front and the white arrows point at the direction of migration. The arrowheads indicate the actin brushes. (Scale bar, 10 µm.) (A′–C′) Time course of the polarity index establishment of the polarization of Ezrin (A′), Esyt2a (B′), or MTs (C′) within the cells presented in A–C. In A′ and B′ the signal was measured only at the level of the membrane; time appears in seconds. (D) Time of ligand-independent polarization of the rear markers relative to the time of actin accumulation at the cell front (time 0) (median, 5 and 95 percentiles are presented, n = number of cells, time is in seconds). (E–G) Establishment of polarity following cell division. Lifeact presented in magenta and the rear markers in green: (E) Ezrin, (F) Esyt2a, and (G) MTs. Apolar cells prior to cytokinesis (Left) and subsequent panels present the progression through cell division, with the polarized daughter cell (Right). (Scale bar, 10 µm.) |