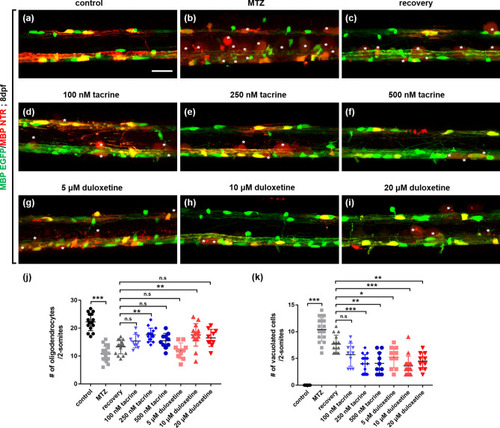
Effects of L1 mimetic compounds on the regeneration of oligodendrocytes in the spinal cord after oligodendrocyte ablation. All images are lateral views of the spinal cord of Tg(mbpa:gal4-vp16;uas:gfp;uas:NTR-mCherry) larvae at 8 days post-fertilization (dpf), anterior to the left and dorsal to the top. Fluorescence indicates MBP-positive oligodendrocytes and myelin sheaths in the spinal cord (a–i). White asterisks indicate debris of vacuolated oligodendrocytes. (j) Quantification of the number of oligodendrocytes per 2-somite area. Control: 22.27 ± 3.15, MTZ: 10.8 ± 2.90, recovery: 13.33 ± 2.55, 100 nM tacrine: 15.4 ± 2.41, 250 nM tacrine: 17.6 ± 2.41, 500 nM tacrine: 15.5 ± 1.64, 5 μM duloxetine: 11.9 ± 2.84, 10 μM duloxetine: 17.6 ± 4.05, 20 μM duloxetine: 16.5 ± 3.06. (k) Quantification of the number of vacuolated cells per 2-somite area. Control: 0, MTZ: 10.4 ± 2.36, recovery: 7.67 ± 1.68, 100 nM tacrine: 5.7 ± 2.16, 250 nM tacrine: 4 ± 1.73, 500 nM tacrine: 4.1 ± 2.02, 5 μM duloxetine: 5.2 ± 1.99, 10 μM duloxetine: 3.6 ± 1.84, 20 μM duloxetine: 4.5 ± 1.58. n = 15 for the control, recovery, 250-nM tacrine, and 10-μM duloxetine groups; n = 18 for the MTZ group; n = 10 for the 100- and 500-nM tacrine and 1-, and 20-μM duloxetine groups. ***p < 0.001; **p < 0.01; *p < 0.05; n.s., not significant. Scale bar, 25 μm.
|
