
- Title
-
Small compounds mimicking the adhesion molecule L1 improve recovery in a zebrafish demyelination model
- Authors
- Kim, S., Lee, D.W., Schachner, M., Park, H.C.
- Source
- Full text @ Sci. Rep.

ZFIN is incorporating published figure images and captions as part of an ongoing project. Figures from some publications have not yet been curated, or are not available for display because of copyright restrictions. PHENOTYPE:
|
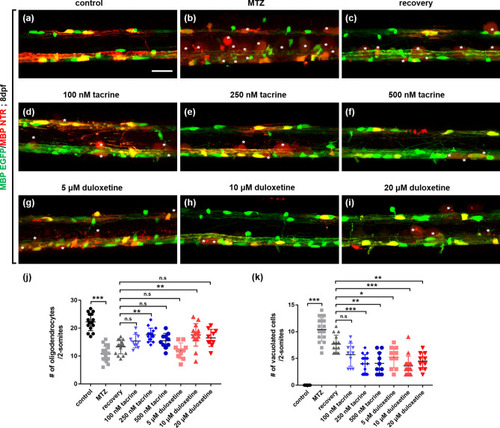
Effects of L1 mimetic compounds on the regeneration of oligodendrocytes in the spinal cord after oligodendrocyte ablation. All images are lateral views of the spinal cord of |
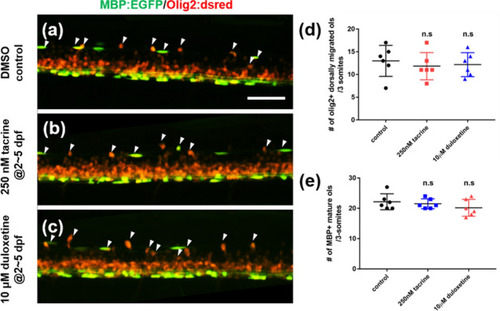
Tacrine and duloxetine show no effect on oligodendrocyte differentiation during development. All images are lateral views of the spinal cord of |
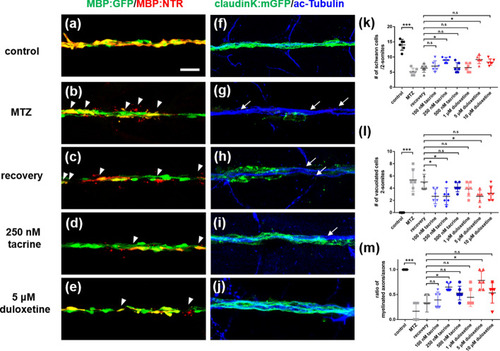
Tacrine and duloxetine enhance regeneration of Schwann cells in posterior lateral line axons after Schwann cell ablation. All images are lateral views of the posterior lateral line of (a–e) Tg(mbpa:gal4-vp16;uas:egfp;uas:NTR-mCherry), (f–j) Tg(claudinK:gal4-vp16;uas:megfp;uas:NTR-mCherry) larvae at 8 days post-fertilization (dpf). Anterior to the left and dorsal to the top. (a–e) GFP fluorescence indicates MBP-positive Schwann cells and red fluorescence indicates NTR + Schwann cells or vacuolated Schwann cells. Arrowheads indicate vacuolated cells. (f–j) GFP fluorescence indicates ClaudinK-positive myelin sheaths and blue fluorescence indicates acetylated tubulin-positive PLL axons. Arrows indicate demyelinated axons without GFP + myelin sheaths. (k) Quantification of the number of Schwann cells per 2-somite area. Control: 14 ± 1.79, MTZ: 5.16 ± 1.17, recovery: 6.33 ± 0.37, 100 nM tacrine: 7 ± 1.79, 250 nM tacrine: 9 ± 0.89, 500 nM tacrine: 6.5 ± 1.64, 1 μM duloxetine: 6.5 ± 1.33, 5 μM duloxetine: 9.17 ± 0.32, 10 μM duloxetine: 8.33 ± 1.03. (l) Quantification of the number of vacuolated cells per 2-somite area. Control: 0, MTZ: 5.33 ± 1.86, recovery: 5 ± 1.26, 100 nM tacrine: 2.67 ± 1.21, 250 nM tacrine: 2.67 ± 1.7, 500 nM tacrine: 4.17 ± 0.75, 1 μM duloxetine: 3.83 ± 1.17, 5 μM duloxetine: 2.27 ± 1.03, 10 μM duloxetine: 3.17 ± 1.17. (m) Ratio of the number of myelinated axons is indicated per total number of axons. Control: 1, MTZ: 0.165 ± 0.18, recovery: 0.33 ± 0.18, 100 nM tacrine: 0.39 ± 0.16, 250 nM tacrine: 0.65 ± 0.08, 500 nM tacrine: 0.53 ± 0.14, 1 μM duloxetine: 0.44 ± 0.18, 5 μM duloxetine: 0.78 ± 0.18, 10 μM duloxetine: 0.53 ± 0.2. n = 6 per group. The experiment was independently repeated three times. ***p < 0.001; **p < 0.01; *p < 0.05; n.s., not significant. Scale bar, 25 μm. |
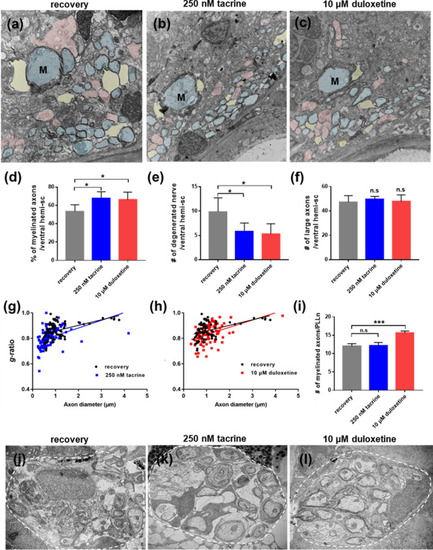
Tacrine and duloxetine promote remyelination after demyelination. Transmission electron microscopic images of transverse sections of the PHENOTYPE:
|

Tacrine, but not duloxetine, promotes restoration of locomotor activity. ( |