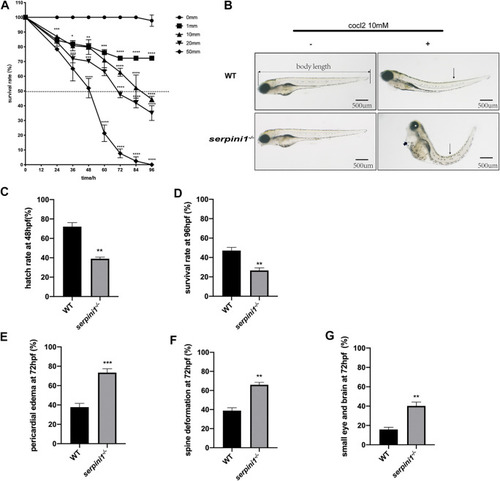
The developmental morphology defects of WT and serpini1−/− zebrafish under CoCl2 induced hypoxia damage. (A) Survival rates of WT under the different concentration of CoCl2: 0, 1, 10, 20, 50 mM from 12 hpf to 96 hpf. The data are presented as the mean ± SEM, n = 200 per group. Statistical analyses were performed with one-way ANOVA, followed by Dunnett’s multiple comparisons, *p < 0.05, **p < 0.01, ***p < 0.001, ****p < 0.0001 compared to WT at the same timepoint. Dash line indicates of 50% survival rate. (B) Typical morphological defects under the treatment of 10 mM CoCl2 in WT and serpini1−/− zebrafish at 4dpf; short arrow indicates pericardial edema; long arrow shows spine deformation and asterisk shows small eye deformation. (C) Hatch rate at 48 hpf under the treatment of 10 mM CoCl2 between WT and serpini1−/− group. The data are presented as the mean ± SEM, n = 200 per group; three trails for the experiment. Statistical analyses were performed with Student’s t-test, **p < 0.01 compared to WT. (D) Survival rate at 96 hpf under the treatment of 10 mM CoCl2 between WT and serpini1−/− group. The data are presented as the mean ± SEM, n = 200 per group; three trails for the experiment. Statistical analyses were performed with Student’s t-test, **p < 0.01 compared to WT. (E–G) Percentage of pericardial edema, spine deformation, and small eye and brain deformation in WT and serpini1−/− group under the treatment of 10 mM CoCl2. The data are presented as the mean ± SEM, n = 200 per group; three trails for the experiment. Statistical analyses were performed with Student’s t-test, **p < 0.01, ***p < 0.001.
|
