
Figure 4
- ID
- ZDB-FIG-210319-15
- Publication
- Vinayagam et al., 2020 - Structural basis of TRPC4 regulation by calmodulin and pharmacological agents
- Other Figures
-
- Figure 1.
- Figure 2
- Figure 2—figure supplement 1.
- Figure 2—figure supplement 2.
- Figure 2—figure supplement 3.
- Figure 2—figure supplement 4.
- Figure 2—figure supplement 5.
- Figure 3
- Figure 3—figure supplement 1.
- Figure 4
- Figure 4—figure supplement 1.
- Figure 4—figure supplement 2.
- Figure 5
- Figure 5—figure supplement 1.
- Figure 5—figure supplement 2.
- Figure 5—figure supplement 3.
- Figure 5—figure supplement 4.
- Figure 5—figure supplement 5.
- Figure 5—figure supplement 6.
- Figure 6.
- Figure 7.
- All Figure Page
- Back to All Figure Page
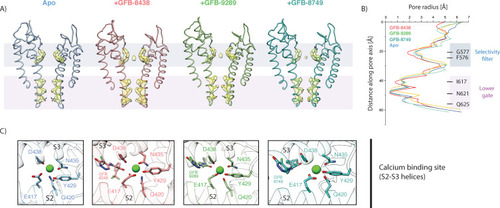
(A) Side view of the pore-forming region of TRPC4 in the apo- (blue), GFB-8438 (red) GFB-9289 (green) and GFB-8749 (cyan-blue) inhibitor-bound structures. Only the two opposing subunits of the tetrameric channel are shown as ribbon representation for clarity. The density at comparable thresholds corresponding to the selectivity filter (light blue) and the lower gate (pink) is shown. A central density is observed in all maps, except the apo structure. (B) The calculated pore-radii corresponding to the four TRPC structures in (A) are depicted. The color code is also identical to (A). The positions of important residues, constituting the selectivity filter and the lower gate, are indicated on the right. (C) Close-up of the Ca2+-binding site in the four TRPC4 structures, located in direct vicinity to the ligand binding pocket of the VSL domain. Position of ligands and coordinating residues are highlighted. Color code of TRPC4 structures is as in (A). |