
- Title
-
Structural basis of TRPC4 regulation by calmodulin and pharmacological agents
- Authors
- Vinayagam, D., Quentin, D., Yu-Strzelczyk, J., Sitsel, O., Merino, F., Stabrin, M., Hofnagel, O., Yu, M., Ledeboer, M.W., Nagel, G., Malojcic, G., Raunser, S.
- Source
- Full text @ Elife
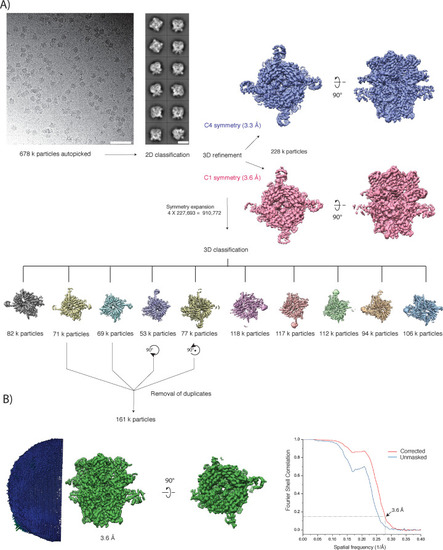
( |

(A) Side and top view of the cryo-EM map of GFB-8438 inhibitor-bound TRPC4, with each subunit colored differently. Positions of the transmembrane domain (TMD) and intracellular cytosolic domain (ICD) are indicated. (B) Side and top view of the structure of GFB-8438 inhibitor-bound TRPC4, with each subunit colored differently. (C) Location of non-protein densities relative to the atomic model of TRPC4, which is shown in transparent ribbon representation in the side- and top view. Densities corresponding to lipids are depicted in red, GFB-8438 density is shown in purple. (D) Close-up of the ligand-binding pocket, showing the density corresponding to the inhibitor GFB-8438(transparent) with the ligand structure modelled inside. GFB-8438 is enclosed by the four helices S1 to S4, constituting the VSL domain. A rotated view of the ligand-binding pocket is shown in the left panel with important and interacting residues highlighted. GFB-8438 is shown in purple. In the right panel the chemical structure of the TRPC4 inhibitor GFB-8438 is shown, with important and interacting residues of TRPC4 highlighted. Non-carbon atoms are colored according to element, with halogens in green, nitrogen in blue and oxygen in red. (E) and (F) Same in (D) but for inhibitor GFB-9289 and GFB-8749 bound structures of TRPC4 respectively. |

( |

( |
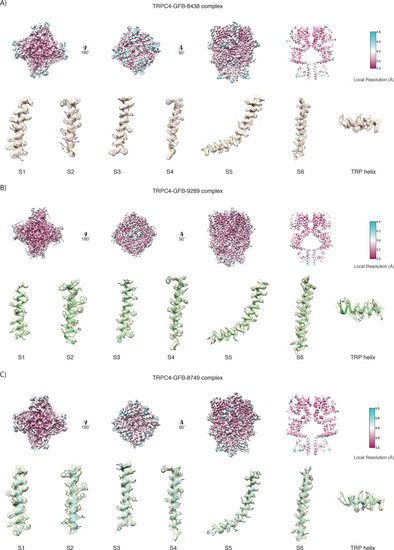
Maps of GFB-8438, GFB-9289 and GFB-8749-bound TRPC4, respectively, colored according to the local resolution. Representative regions of the density with the fitted atomic model are shown below the local resolution maps. |

( |

Cartoon representation of a TRPC4 protomer. Each domain is shown in a different color and labeled accordingly. |

(A) Close-up of ligand-binding pocket in the apo TRPC4 structure, which is enclosed by the four helices S1 to S4 of the voltage sensing-like domain. (B) Superposition of inhibitor-bound (red) and apo (blue) structure of TRPC4. A close-up of the ligand-binding pocket is shown, with important and interacting residues highlighted. The inhibitor GFB-8438 is depicted in red, positions of the surrounding helices S1 to S4 are indicated. (C) and (D) Same as in (B) for the inhibitor GFB-9289 and GFB-8749 -bound TRPC4 structures respectively. The structures of GFB-9289 and GFB-8749 are depicted in green and cyan respectively. In all the inhibitor-bound structures, several residues move away from the center of the pocket to create space for accommodating the respective ligand. (E) Position of the inhibitor AM-1473 within the VSL domain binding pocket of TRPC6 is shown. The surrounding helices S1-S3 are indicated for orientation. (F) Superposition of GFB-8438-bound TRPC4 (red) and AM-1473-bound TRPC6 (purple) channels. The location of the GFB-8438 inhibitor within the VSL domain is shown. In contrast to AM-1473, which is located in the lower part of the binding pocket (see E), GFB-8438 additionally interacts with the upper region of the pocket. The depicted residues in this region contribute to the selectivity of GFB-8438 for TRP4/5 channels. (G) Comparison of small-molecule modulators of the TRP channel family that target the ligand-binding pocket enclosed by the helices of the VSL domain (VSLD). Small molecules are depicted as space-filled spheres with inhibitors shown in red. Residues interacting with the ligand are shown in stick representation. Pore helices are colored in blue, the TRP helix in orange. |

The highlighted and marked residues denote the conserved residues in TRPC4 and TRPC5 interacting with the inhibitor GFB-8438. The residues highlighted in pink color shows the critical difference between TRPC4/5 and TRPC6 for the inhibitor binding site. |
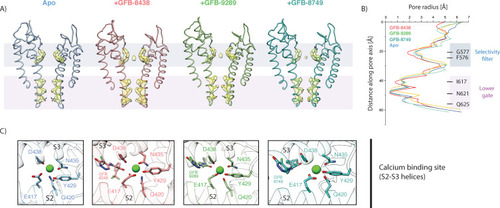
(A) Side view of the pore-forming region of TRPC4 in the apo- (blue), GFB-8438 (red) GFB-9289 (green) and GFB-8749 (cyan-blue) inhibitor-bound structures. Only the two opposing subunits of the tetrameric channel are shown as ribbon representation for clarity. The density at comparable thresholds corresponding to the selectivity filter (light blue) and the lower gate (pink) is shown. A central density is observed in all maps, except the apo structure. (B) The calculated pore-radii corresponding to the four TRPC structures in (A) are depicted. The color code is also identical to (A). The positions of important residues, constituting the selectivity filter and the lower gate, are indicated on the right. (C) Close-up of the Ca2+-binding site in the four TRPC4 structures, located in direct vicinity to the ligand binding pocket of the VSL domain. Position of ligands and coordinating residues are highlighted. Color code of TRPC4 structures is as in (A). |
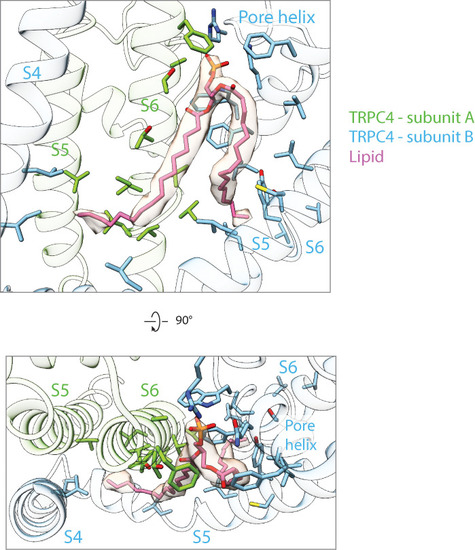
Phosphatidic acid (pink) that binds at the interface between two subunits near the pore region is shown in stick representation along with the corresponding density. The interacting residues from the S4, S5 and S6 helices are also shown in stick representation. The protein residues from different protomers are colored differently. The helices are shown in cartoon representation with high transparency. |

( |

(A) One to four CaM molecules are bound to the CIRB binding sites of the tetrameric TRPC4 channel. 13% of particles are decorated with one (yellow), 35% with two (lilac), 31% with three (grey) and 20% with four CaM molecules (turquoise). (B) Side view of the CaM-bound TRPC4 density map (transparent) with the corresponding atomic model fitted inside, in which each protomer is colored differently. Position of the horizontal helix is indicated by black arrowhead. The bottom view of the atomic model is shown in the right panel. A schematic representation for both views is provided next to the atomic models. CaM is colored in orange. (C) Close-up of the indicated region in (B), showing the CaM binding region (left panel). CaM is colored in orange, TRPC4 in green. Positions of the horizontal helix and loop region 273–277 are indicated by black and blue arrowhead, respectively. Important and the predicted interacting residues of TRPC4 and CaM based on our model are highlighted in the right panel. (D) TRPC4 (cartoon representation) and CaM (surface representation) are colored according to hydrophobicity. There is a central hydrophobic cavity in CaM that is surrounded by hydrophilic residues in its periphery. The complementary binding region of TRPC matches this profile. (E) The C-terminal helix (red), the rib-helix (red-orange), the horizontal helix (purple), the TRP helix (orange) and the pore-forming helices (blue) of a single TRPC4 promoter are shown before (left panel) and after CaM binding (right panel). CaM binding stabilizes the previously disordered region connecting the rib-helix and horizontal/TRP-helix. LMNG – lauryl maltose neopentyl glycol. |

( |
( |

( |

( |

( |

( |

(A) Calmodulin (CaM) interacts with the rib helix of TRPC4. Side (upper panel) and bottom (lower panel) view of the CaM-bound TRPC4 is shown, with TRPC4 structure in cartoon representation with moderate transparency and CaM in space filling sphere representation. Only a single lobe of the double-lobed CaM molecule is resolved in the structure. This indicates that the second lobe is rather flexible. Up to four binding sites are accessible for CaM (only one binding event is shown here for clarity). (B) Same as in (A) for TRPV5. The two-lobed CaM binds into the central cytoplasmic cavity of TRPV5. While four potential binding sites are available in TRPV5, only a single CaM molecule can bind due to steric hindrance. Unlike TRPC4, in which the C-terminal helices block the access to the cytoplasmic cavity, CaM can enter into the internal cavity of TRPV5 from the cytoplasm. (C) Same as in (A) for TRPV6. Similar to TRPV5, only a single CaM molecule binds to a region within the cytoplasmic cavity of TRPV6, indicating that this binding mode is conserved among TRPV channels. |

( |