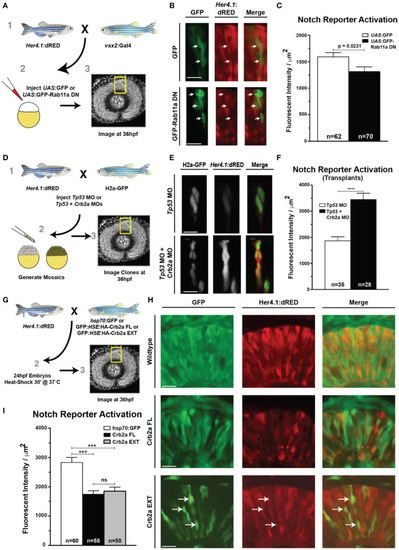
Rab11aDN expression and Crb2a function to inhibit Notch-reporter activation. (A) Schematic of experiments assessing the her4.1:dRED Notch reporter activity in control (UAS:GFP) or (UAS:GFP-Rab11aDN) injected embryos. (B) Representative images of Notch-reporter (her4.1:dRED) activity in control (top) and Rab11aDN (bottom) expressing cells. (C) Quantification of relative Notch-reporter (her4.1:dRED) fluorescence in GFP-labeled cells. (D) Schematic of genetic mosaic experiments for Control (Tp53 MO), her4.1:dRED/H2a:GFP cells or Crb2a morphant (Tp53 + Crb2a MO), her4.1:dRED/H2a:GFP to detect autonomous Notch-reporter activation within a wildtype background. (E) Example of Notch reporter (her4.1:dRED) activation in Control (top) and Crb2a morphant (bottom) clones. (F) Quantification of Notch reporter fluorescent intensities (her4.1:dRED) of Control and Crb2a morphant cells. (G) Schematic of experiments examining the consequence of heat-shock activation of control (GFP), Crb2a-FL, or Crb2a-EXT transgenes on Notch reporter (her4.1:dRED) activation H) Representative images of her4.1:dRED after expression of GFP, Crb2a-FL, Crb2a-EXT transgenes in 36 hpf retinas. Arrows in lower panels indicate locations of high Crb2a-EXT expressing cells that show low activation of the Notch reporter (her4.1:dRED) transgene. (I) Quantification of Notch-reporter activation in Control (GFP), Crb2a-FL, or Crb2a-EXT overexpressing cells. Bar graphs in (C,F,I) represent mean her4.1:dRED Notch reporter activation across individual cells, normalized per unit area, with error bars indicating SEM. Statistics in (C,F) are the result of an unpaired t-test, while statistics in (I) represent results of a One-way ANOVA followed by Tukey's Multiple Comparisons Test. ***p < 0.001; ****p < 0.0001. n-values in (C,F,I) represent number of cells counted from at least five different embryos for each experimental condition. Scale bars represent 25 μm.
|
