
FIGURE
Fig. 3
- ID
- ZDB-FIG-210225-46
- Publication
- Li et al., 2020 - Molecular evolution of melatonin receptor genes (mtnr) in vertebrates and its shedding light on mtnr1c
- Other Figures
- All Figure Page
- Back to All Figure Page
Fig. 3
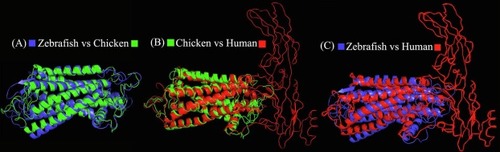
Fig. 3. Predicted 3D-structure comparisons of MTNR1C among zebrafish, chicken and human. (A) Zebrafish MTNR1C (blue) versus chicken (green); (B) Chicken MTNR1C (green) versus human (red); (C) Zebrafish MTNR1C (blue) versus human (red). (For interpretation of the references to colour in this figure legend, the reader is referred to the web version of this article.) |
Expression Data
Expression Detail
Antibody Labeling
Phenotype Data
Phenotype Detail
Acknowledgments
This image is the copyrighted work of the attributed author or publisher, and
ZFIN has permission only to display this image to its users.
Additional permissions should be obtained from the applicable author or publisher of the image.
Reprinted from Gene, 769, Li, Y., Lv, Y., Bian, C., You, X., Shi, Q., Molecular evolution of melatonin receptor genes (mtnr) in vertebrates and its shedding light on mtnr1c, 145256, Copyright (2020) with permission from Elsevier. Full text @ Gene