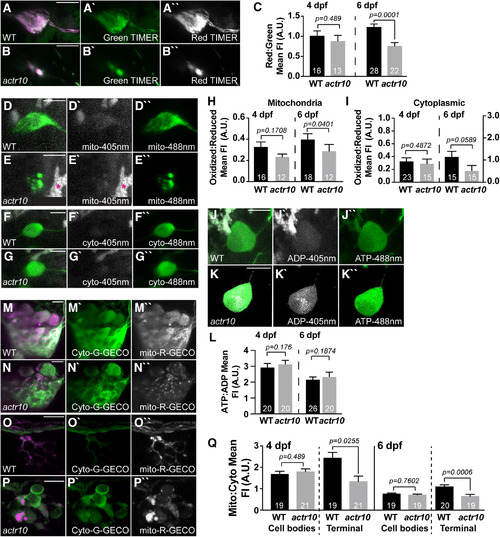
Mitochondrial calcium load is decreased in axon terminal mitochondria in actr10nl15 mutants. A–C, TIMER fluorescence in the cell body mitochondria show lower cumulative ROS exposure by 6 dpf with retrograde mitochondrial transport inhibition (ANOVA); 4 dpf, WT: 1.01 ± 0.12; actr10nl15: 0.88 ± 0.14; 6 dpf, WT: 1.23 ± 0.08; actr10nl15: 0.76 ± 0.08. D–I, roGFP2 expression in mitochondria and the cytosol of the cell body shows no change in acute ROS at 4 or 6 dpf in actr10nl15 mutants (ANOVA). Mitochondrial: 4 dpf, WT: 0.33 ± 0.04; actr10nl15: 0.23 ± 0.05; 6 dpf, WT: 0.40 ± 0.05; actr10nl15: 0.29 ± 0.07. Cytoplasmic: 4 dpf, WT: 0.34 ± 0.06; actr10nl15: 0.29 ± 0.07; 6 dpf, WT: 1.17 ± 0.27; actr10nl15: 0.52 ± 0.29. J–L, Cell body ATP:ADP ratios, measured using PercevalHR expression, are unchanged in actr10nl15 mutants (ANOVA); 4 dpf, WT: 3.01 ± 0.29; actr10nl15: 3.14 ± 0.29; 6 dpf, WT: 2.12 ± 0.23; actr10nl15: 2.34 ± 0.26. M–Q, Cell bodies (M, N) and axon terminals (O, P) expressing mitochondrially localized R-GECO (magenta in merge, white in single channel) and cytoplasmic G-GECO (green) in WT and actr10nl15 mutants at 4 dpf. Q, Quantification of mitochondrial:cytoplasmic GECO signal at 4 and 6 dpf in the pLLg and axon terminals (ANOVA or Wilcoxon rank-sum). Ganglion: 4 dpf, WT: 1.69 ± 0.13; actr10nl15: 1.81 ± 0.12; 6 dpf, WT: 0.70 ± 0.04; actr10nl15: 0.66 ± 0.04. Axon terminal: 4 dpf, WT: 2.45 ± 0.25; actr10nl15: 1.35 ± 0.24; 6 dpf, WT: 1.02 ± 0.08; actr10nl15: 0.60 ± 0.08. Sample sizes indicated on graph. Scale bar: 10 µm. All data are mean ± SEM.
|
