
Fig. 3
- ID
- ZDB-FIG-210223-28
- Publication
- Huang et al., 2021 - Sodium dehydroacetate induces cardiovascular toxicity associated with Ca2+ imbalance in zebrafish
- Other Figures
- All Figure Page
- Back to All Figure Page
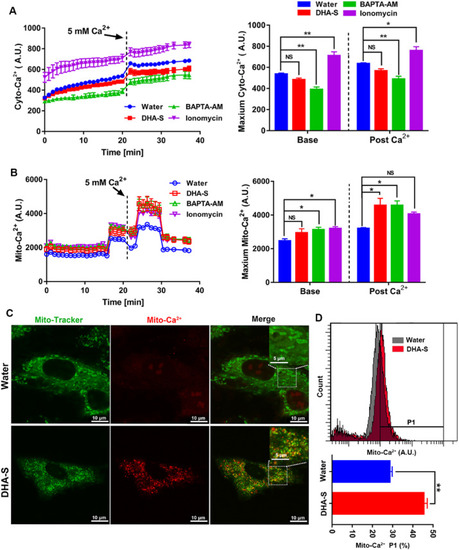
Fig. 3. DHA-S evoked mitochondrial Ca2+ accumulated in H9c2 cells. A, Dynamic change of cytoplasm Ca2+ was determined by Fluo3-AM. Right, quantification of the Fluo3 fluorescence intensity before and after adding Ca2+ (5 mM). Data were analyzed by one-way analysis of variance (ANOVA) test; F (3, 8) = 33.8 and F (3, 8) = 20.97 for the base and post Ca2+, respectively. H9c2 treated with the DHA-S (1 g/L, about 5 mM) in EBSS. BAPTA-AM and ionomycin were utilized as negative and positive control, respectively. B, Dynamic change of mitochondrial Ca2+ was determined by Rhod2-AM. Right, quantification of the Rhod2 fluorescence intensity before and after adding Ca2+ (5 mM). Data were analyzed by one-way analysis of variance (ANOVA) test; F (3, 8) = 4.163 and F (3, 8) = 6.465 for the base and post Ca2+, respectively. C, Represented images of H9c2 cells, after treated with DHA-S (5 g/L, 25 mM) for 24 h, labeled with Rhod-2 AM and Mito-Tracker Green. Scale bar, 10 µm. D, Quantification of the Rhod-2-positive cells in P1 gate by FACS and the results showed as histograms (down). Data were analyzed by Student’s unpaired T test. All experiments were repeated three times and the data were expressed as mean ± SEM. *, P < 0.05; and * *, P < 0.01; *** , P < 0.001; and *** *, P < 0.0001. |