
Fig. 1
- ID
- ZDB-FIG-210218-115
- Publication
- Kontur et al., 2020 - Ythdf m6A Readers Function Redundantly during Zebrafish Development
- Other Figures
- All Figure Page
- Back to All Figure Page
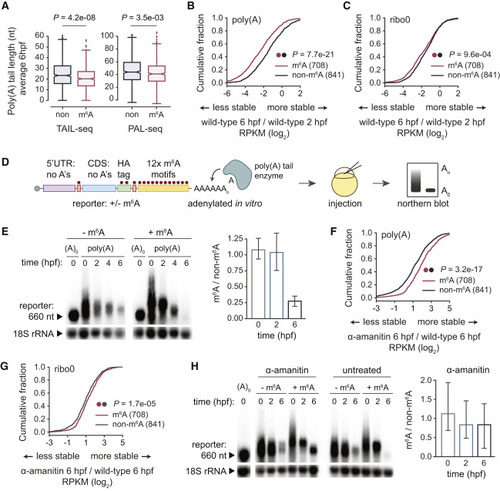
Figure 1. m6A Methylation Promotes Deadenylation of Maternal mRNAs (A) Average poly(A) tail lengths at 6 hpf for m6A-modified (m6A, n = 675) and non-modified (non, n = 841) maternal mRNAs from TAIL-seq and PAL-seq datasets. Box, first to last quartiles; whiskers, 1.5× interquartile range; center line, median; diamonds, outliers. (B and C) Cumulative distributions of fold changes in maternal mRNA abundance (log2 RPKM) between 6 and 2 hpf in wild-type embryos, for m6A-modified (n = 708) and non-modified mRNAs (n = 841), from poly(A) (B) or ribo0 (C) mRNA-seq. (D) Schematic of methylated mRNA reporter assay. The mRNA reporter had a 5′ UTR and CDS without adenines, AUG start, and UAG stop codons, and 3′ UTR with 12× m6A motifs (GGACT). The reporter was in vitro transcribed with or without m6A-modified adenines and polyadenylated. Reporter mRNA was injected into embryos and mRNA levels and polyadenylation were visualized by Northern blots. (E) Northern blot of m6A-modified (+m6A) and unmodified (−m6A) reporter at various time points (hpf) in wild-type embryos. Loading control (18S rRNA, ~1,900 nt) on bottom. Ratio of m6A to non-m6A reporter abundance (18S rRNA normalized, mean ± SD, n = 5 independent replicates) on right. A0, reporter injected without poly(A) tail. (F and G) Cumulative distributions of fold changes in maternal mRNA abundance (log2 RPKM) between α-amanitin treated and wild-type at 6 hpf, for m6A-modified (n = 708) and non-modified mRNAs (n = 841), from poly(A) (F) or ribo0 (G) mRNA-seq. (H) Northern blot of m6A-modified (+m6A) and unmodified (−m6A) reporter at various time points (hpf) in α-amanitin and untreated embryos. Loading control (18S rRNA, ~1,900 nt) on bottom. Ratio of m6A to non-m6A reporter abundance (18S rRNA normalized, mean ± SD, n = 3 independent replicates) for α-amanitin on right. A0, reporter injected without poly(A) tail. p values (A–C, F–G) were computed by a Mann-Whitney U test. |