|
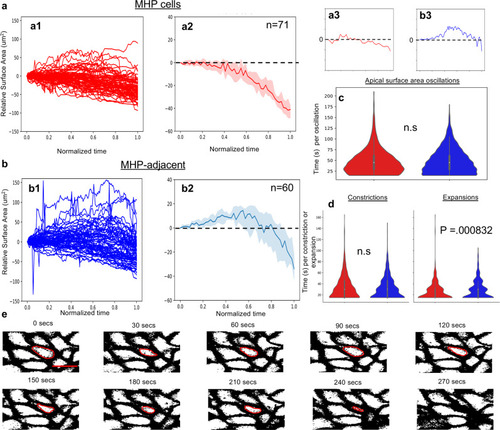
Oscillatory constriction with decreasing amplitude reduces the apical surface of MHP cells.a Measurements of medial, MHP cells. a1 Relative apical surface areas over time for individual MHP cells. a2 Median values of MHP relative apical surface areas over time, 95% confidence interval, n = 71. a3 Representative trace of relative apical surface area over time for an individual MHP cell. b Measurements of MHP-adjacent cells. b1 Relative apical surface areas over time for individual MHP-adjacent cells. b2 Median values of MHP-adjacent relative apical surface areas over time, 95% confidence interval. b3 Representative trace of relative apical surface area over time for an individual MHP-adjacent cell. c Distributions of the duration of oscillation between two expanded states for MHP cells (red, median of 45 s per oscillation) and MHP-adjacent cells (blue, median of 45 s per oscillation). No significant difference (two-sided Mann–Whitney U test, P = 0.293, AUC = 0.489, n = 758 MHP cell oscillations, n = 1,113 MHP-adjacent oscillations). d Distributions of the timing of apical constrictions or expansions for MHP cells (red) and MHP-adjacent cells (blue). There is no significant difference between the two groups for constriction time (two-sided Mann–Whitney U test: constrictions, P = 0.541, AUC = 0.510, n = 458 MHP cell constrictions, n = 640 MHP-adjacent constrictions) but there is a statistically significant difference for expansion time (P = 0.000832, AUC = 0.441, n = 367 MHP cell expansions, n = 596 MHP-adjacent expansions). The median time for individual expansions of MHP and MHP-adjacent cells is 15 and 30 s, respectively. All boxplot elements depict quartiles with the centerline depicting the median. e Still frames of time-lapse movie of mGFP-labeled cells shown in greyscale. The oscillatory behavior of one cell, outlined in red, is shown over time. Scale bar: 10 μm in e.
|