
Fig. 1
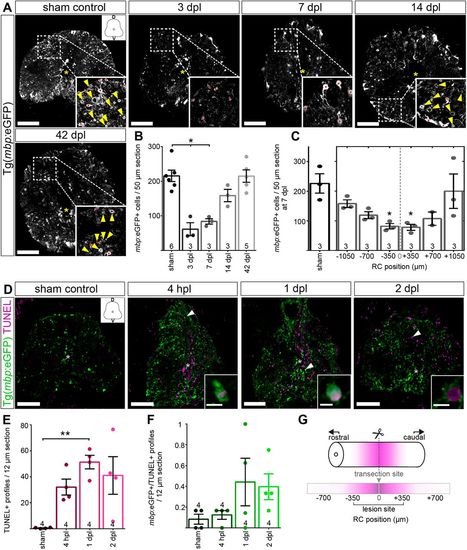
Oligodendrocyte numbers are transiently decreased and re-established after SCI. (A) mbp:eGFP+ oligodendrocyte somata (insets, red dots) and myelin sheaths (insets, yellow arrowheads) are reduced after SCI, but the population is re-established at 14 dpl. Images are maximum intensity projections of transverse sections. D, dorsal; V, ventral. In the overview images, a yellow asterisk indicates the central canal. Scale bars: 100 μm. (B) Stereological quantification of mbp:eGFP+ somata 350 µm rostral and caudal to the transection site shows a significant reduction in the number of oligodendrocytes at 7 dpl, compared to sham controls. Evidence of re-myelination is detected as early as 14 dpl (inset, yellow arrowheads). Data are mean±s.e.m. Numbers in the plots indicate the number of experimental animals. *P≤0.05 (Kruskal–Wallis followed by Dunn's multiple comparisons post-hoc test). Significance is shown compared to sham control. (C) Stereological quantification of mbp:eGFP+ cells at 7 dpl along the rostrocaudal (RC) axis and around the transection site shows a spatially restricted loss of myelinating oligodendrocytes. Data are mean±s.e.m. Numbers in the plots indicate the number of experimental animals. *P≤0.05 (Kruskal–Wallis followed by Dunn's multiple comparisons post-hoc test). Significance is shown compared to sham control. (D) TUNEL assay to detect dying cells at 4 hpl, 1 dpl and 2 dpl. Images are maximum intensity projections of transverse sections. D, dorsal; V, ventral. In the overview images, a white asterisk indicates the central canal. Scale bars: 5 μm in insets; 100 μm in overviews. (E) TUNEL+ cells were significantly increased at 1 dpl compared to sham controls. Data are mean±s.e.m. Numbers in the plots represent experimental animals. **P≤0.01 (Kruskal–Wallis test followed by Dunn's multiple comparisons post-hoc test). Significance is shown compared to sham control. (F) The number of mbp:eGFP+/TUNEL+ |