
Fig. 4
- ID
- ZDB-FIG-210208-9
- Publication
- Reinoß et al., 2020 - Hypothalamic Pomc Neurons Innervate the Spinal Cord and Modulate the Excitability of Premotor Circuits
- Other Figures
- All Figure Page
- Back to All Figure Page
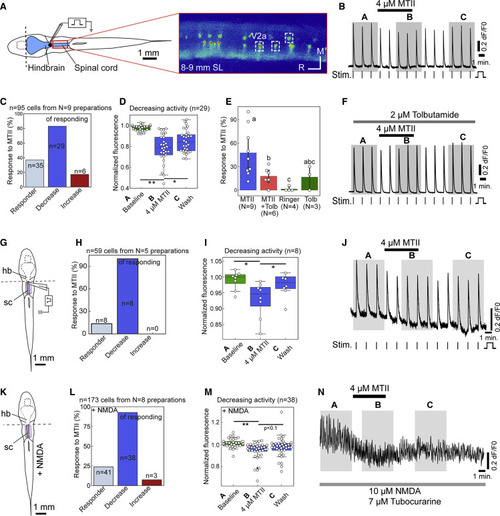
Figure 4. Zebrafish Spinal Networks Respond to the Mc4r Agonist MTII (A) Schematic illustration of the hindbrain-spinal cord preparation (in blue) and exemplary still of Ca2+ transients in spinal V2a neurons of vsx2:Gal4FF; 14xUAS:GCaMP6s larvae of 8–9 mm SL fasted for 1 day, with settings allowing simultaneous recordings in all dorso-ventral planes of the spinal cord. (B) Exemplary recording of individual V2a interneuron showing decreased Ca2+ transients upon bath application of 4–5 μM MTII. Horizontal bars indicate when MTII, vertical bars when the electrical stimuli (Stim) were applied. Shaded areas (A–C) indicate when Ca2+ transients were quantified for (D), (I), and (M). (C) Percentages of V2a neurons responding to applied MTII according to 3-σ criterion (see STAR Methods). (D) Percentages of V2a neurons in which evoked Ca2+ transients were reduced by MTII in a reversible manner. (E and F) The K-ATPase blocker tolbutamide (Tolb, 2 μM) had no major effect on Ca2+ transients (p = 0.81) but prevented the normally decreasing effect of MTII (p = 0.01). (G–J) Schematic illustration of hindbrain-spinal cord preparation for electrical stimulation with section (dashed line) between hindbrain and spinal cord (G), percentages of V2a neurons responding to applied MTII (H), fluorescence values for V2a neurons with a reversible negative response (I), and exemplary recording of individual electrically stimulated V2a interneuron (J). (K–N) Schematic illustration of hindbrain-spinal cord preparation for 10 μM NMDA stimulation with section between hindbrain and spinal cord (K), percentages of V2a neurons responding to applied MTII (L) fluorescence values for V2a neurons with a reversible negative response (M), and exemplary recording of individual NMDA-stimulated V2a interneuron. Tubocurarine was used to prevent muscle contractions. Columns show mean ± 95% confidence intervals; columns with the same superscript letter (a, b, c) are not significantly different (p > 0.05); ∗p < 0.05, ∗∗p < 0.01. Scale bars, 1 mm. |