|
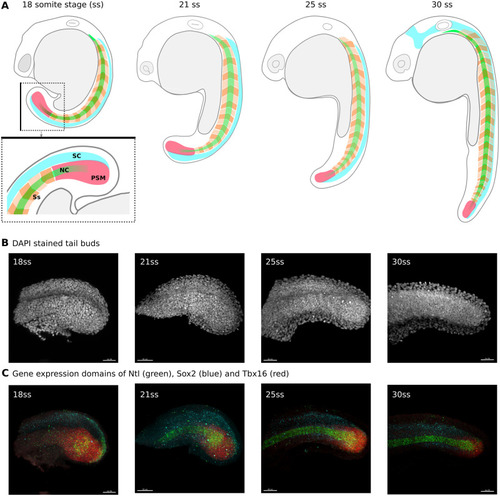
Zebrafish development and the tail bud classification problem.A. Schematic drawings of zebrafish embryos at 18, 21, 25 and 30 somite stages. The tail bud region of the 18 somite stage embryo schematic is shown inside the dotted square and below, rotated 90° to the right and zoomed in. Black line on the boxes to help visualise alignment. Posterior to the right, anterior to the left, dorsal up and ventral down. The spinal cord (SC) is shown in cyan, alternate somites (Ss) are shown in different shades of orange, the notochord (NC) is shown in green and the pre-somitic mesoderm (PSM) is shown in pink. B. Maximum projection images of the tail buds of embryos at the 18, 21, 25 and 30 somite stages respectively, stained with Dapi and imaged on a confocal microscope. C. Maximum projection images of the same tail buds as in B, stained for the mRNA of tbxta (green in the posterios PSM and notochord), tbx16 (red in the PSM) and sox2 (blue in the spinal cord) using HCR V.3 and imaged on a confocal microscope.
|