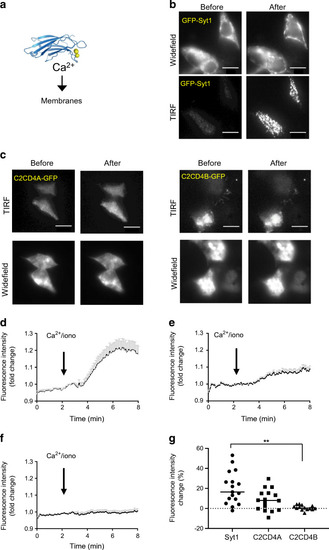
Changes in C2CD4A and C2CD4B localisation in response to increased intracellular [Ca2+]. (a) Schematic showing the principle of Ca2+-dependent translocation of C2 domains to the plasma membrane. The ribbon diagram reproduced from [57] under the terms of the Creative Commons Attribution 4.0 International License (http://creativecommons.org/licenses/by/4.0/), which permits unrestricted use, distribution, and reproduction in any medium. (b) Localisation of GFP-Syt1 in cells incubated in KREBH buffer with 3 mmol/l glucose, shown before and after an increase in intracellular Ca2+ levels (achieved by addition of 50 ng/ml ionomycin), obtained by simultaneous wide-field and TIRF image acquisition (positive control). (c) Localisation of GFP-tagged C2CD4A and -C2CD4B before and after addition of ionomycin, obtained by simultaneous wide-field and TIRF image acquisition. (d, f) Time courses for the translocation of the GFP-tagged proteins, Syt1 (d), C2CD4A (e) or C2CD4B (f) obtained by TIRF imaging before and after addition of ionomycin (iono). (d–f) Solid black lines represent mean; SEM shown by grey bars. (g) Assessment of fluorescence intensity change (%) reveals an increase in C2CD4A intensity at the plasma membrane after the imposed increase in intracellular Ca2+ levels, which was similar to that observed for Syt1 protein translocation, whilst C2CD4B translocation was significantly lower than Syt1. For each condition, n=3 independent experiments were performed; n=44 cells were tracked in Syt1, n=29 cells were tracked in the case of C2CD4A, and n=30 cells were tracked in the case of C2CD4B. Scale bars = 10 μm. **p<0.01, one-way ANOVA
|
