|
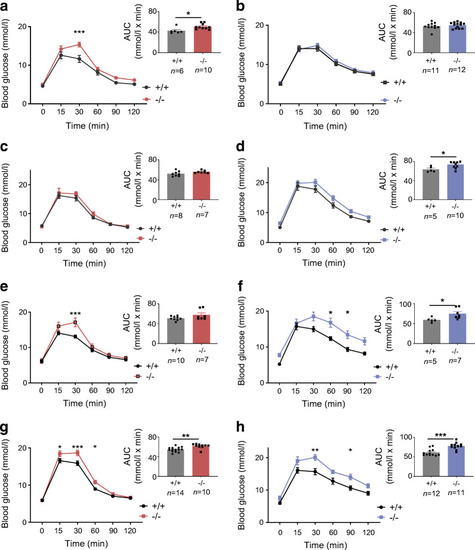
C2cd4b-null mice display glucose intolerance in glucose tolerance tests (IPGTTs/OGTTs). (a, b) IPGTTs were performed on female (a) and male (b) mice maintained on an RC diet, at 22 weeks of age. (c, d) OGTTs were performed on C2cd4b-null and WT female (c) and male (d) mice on an RC, at 20 weeks of age. (e, f) IPGTTs were performed on C2cd4b-null and WT female (e) and male (f) mice maintained on an HFD, at 23 weeks of age. (g, h) OGTTs were performed on C2cd4b female (g) and male (h) mice on an HFD, at 20 weeks of age. AUC analyses are also shown. The n values under bar graphs represent the number of animals used (the same number of samples were used for blood glucose and AUC graphs). *p<0.05, **p<0.01, ***p<0.001 vs mutant animal at same time point or as indicated. Blood glucose curves assessed by two-way ANOVA with Bonferroni’s multiple comparison test; AUC analyses assessed using an unpaired Student’s t test. Values represent means ± SEM
|