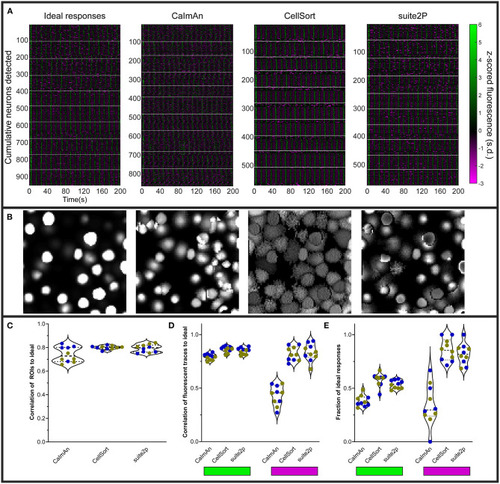
Various analyses' performances on simulated data. (A) Raster plots of ideal responses from NAOMi, and extracted fluorescence traces from CaImAn, CellSort, and suite2p. All the fluorescent traces were z-scored from−3 to 6 s.d. White horizontal lines separate the individual datasets. (B) Segmentation of the regions of interest (ROIs) by each algorithm, as for the raster plots in (A), for one representative dataset. (C) Quantification of the correlation between the ROIs identified by each of the three algorithms and the ideal ROIs. Symbol color indicate the percentage of inhibited neurons (n = 5 datasets with 10% inhibited neurons in blue, and n = 5 datasets with 20% inhibited neurons in yellow). (D) Average maximum correlations between the traces identified by each algorithm and the ideal responses for the activated neurons (left, green rectangle) and the inhibited neurons (right, magenta rectangle). (E) Fraction of the ideal responses identified with a correlation above 0.5 by the three algorithms for the activated neurons (left) and the inhibited neurons (right).
|
