FIGURE

Figure 1

ID
ZDB-FIG-210128-33
Publication
Vanwalleghem et al., 2021 - Calcium Imaging and the Curse of Negativity
Other Figures
All Figure Page
Back to All Figure Page
Figure 1

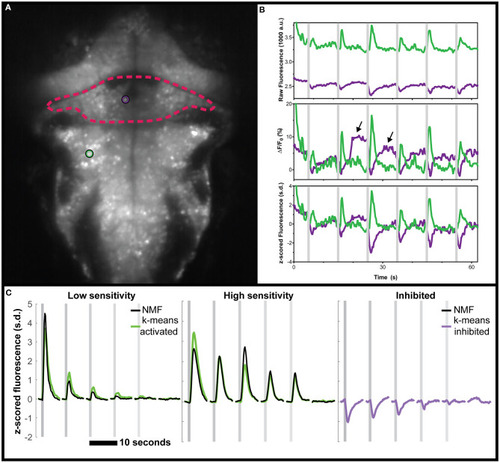
Negative deviations from baseline in real data from the cerebellum of zebrafish, and performance of various analysis tools. (A) Mean fluorescence image of a 6 dpf zebrafish expressing nuclear-targeted GCaMP6s (Chen et al., 2013). The cerebellum is outlined in red, and an inhibited neuron is indicated with a magenta circle. The green circle indicates an activated neuron in the hindbrain. (B) Time traces of the raw (top), ΔF/F0 (middle), or z-scored (bottom) fluorescence for these two neurons, in their respective colors. Arrows indicate positive deviation artifacts resulting from the cessation of inhibition on the inhibited neuron. (C) Comparisons between the clusters identified using k-means (green for activated, magenta for inhibited) and those identified with NMF (black). No inhibited cluster was identified by NMF. Gray shaded areas indicate the time of vestibular stimulation (Favre-Bulle et al., 2018), with a progression from strong to weak stimuli across the stimulus train.

Expression Data

Expression Detail
Antibody Labeling
Phenotype Data

Phenotype Detail
Acknowledgments
This image is the copyrighted work of the attributed author or publisher, and ZFIN has permission only to display this image to its users. Additional permissions should be obtained from the applicable author or publisher of the image. Full text @ Front. Neural Circuits