|
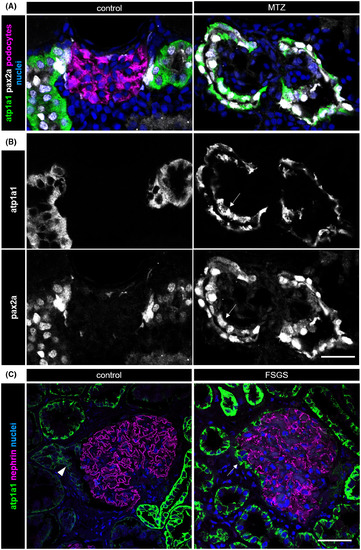
Co‐expression of atp1a1 and pax2a in proximal tubule cells of 9 dpf zebrafish larvae is shown in A. Panel B shows atp1a1 expression and pax2a expression separately. It is limited to the proximal tubule in control larvae; whereas in podocyte‐depleted larvae, it is also found in activated parietal epithelial cells and on the glomerular tuft (white arrows). The scale bar represents 20 µm. The micrographs in C exemplary show atp1a1 expression in a human glomerulus under healthy conditions, where it is limited to the tubule (white arrowhead), and in a patient with FSGS. Notice atp1a1 positivity of cells on the glomerular capillaries in FSGS, highlighted by the white arrow. Nephrin expression marks podocytes. The scale bar represents 50 µm
|