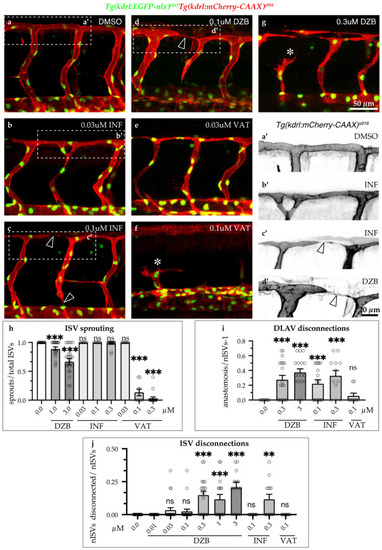
Comparisons of derazantinib, infigratinib and vatalanib during vascular development. Confocal images of GFP+ endothelial cell nuclei and mCherry+ endothelial cell membranes in Tg(kdrl:EGFP-nls)ubs1/Tg(kdrl:mCherry-CAAX)s916 transgenic embryos from 45 hpf in vehicle (DMSO, a) or embryos treated with INF (b,c), VAT (e,f) or DZB (d,g). Treatment with DZB or INF led to blood vessel disconnections (arrowheads) compared to control (a–d). Panels a’–d’ depict zoom-in images of the outlined boxes in a–d marking blood vessel anastomosis defects (arrowheads), scale bar 20 µm. Treatment with DZB and VAT led to sprouting defects (asterisks; e–g). Scale bar for a–g, 50 µm. (h) Quantitative analysis of ISV sprouts that had reached the top roof and started to form the DLAV were normalised to the total number of ISVs per embryo (n ≥ 15 embryos per treatment were analysed from three independent experiments). (i) Quantitative analysis of ISV sprouts that were disconnected at the DLAV were normalised to the total number of ISVs-1 (total number of connections) per embryo (n ≥ 15 embryos per treatment were analysed from three independent experiments). (j) Quantitative analysis of ISV sprouts that are disconnected from the dorsal aorta were normalised to the total number of ISVs per embryo (total number of connections) per embryo (n ≥ 15 embryos per treatment were analysed from three independent experiments). Data in h–j represent mean ± S.E.M. (error bars), ns: not significant, ** p < 0.01, *** p < 0.001. Statistical analysis was performed with the two-sided Mann–Whitney test. See also Figure S2.
|
