
FIGURE
Figure 2
- ID
- ZDB-FIG-210117-49
- Publication
- Liu et al., 2021 - Impact of low-frequency coding variants on human facial shape
- Other Figures
- All Figure Page
- Back to All Figure Page
Figure 2
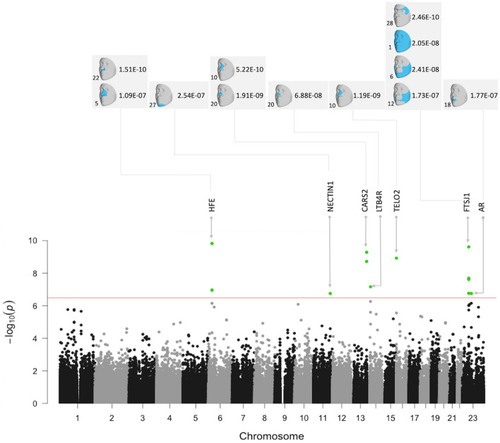
Composite Manhattan plot showing results across 31 facial modules. Manhattan plot showing the position of genes on the x axis and MultiSKAT p-values on the y axis. A total of 31 points are plotted for each gene, representing their p-values in each of the 31 modules. The red horizontal line indicates the significance threshold (3.3 × 10⁻⁷). The associated facial modules and the corresponding p-value for each gene that surpassed the threshold (marked as green dots) are shown above the Manhattan plot. The numbers to the bottom left of the facial images indicate the module identifiers in Fig. |
Expression Data
Expression Detail
Antibody Labeling
Phenotype Data
Phenotype Detail
Acknowledgments
This image is the copyrighted work of the attributed author or publisher, and
ZFIN has permission only to display this image to its users.
Additional permissions should be obtained from the applicable author or publisher of the image.
Full text @ Sci. Rep.