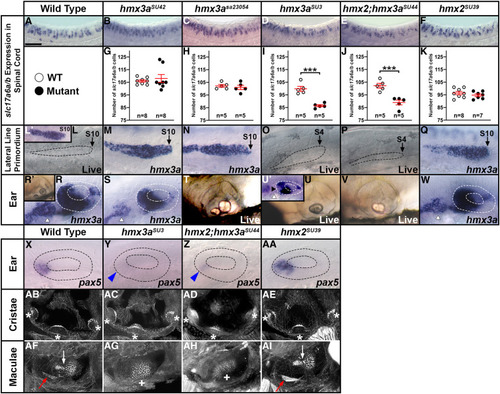
Only some hmx2/3a alleles have mutant phenotypes. (A–F, L–AI, L’, R’ U’) Lateral views. Rostral, left; Dorsal, up. (A–F) Expression of slc17a6a/b in spinal cord at 27 hpf. (G–K) Number of cells expressing slc17a6a/b in a precisely defined spinal cord region adjacent to somites 6–10 at 27 hpf. Data are depicted as individual value plots and the n-values for each genotype are also shown. For each plot, the wider red horizontal bar depicts the mean number of cells and the red vertical bar depicts the SEM (SEM values are listed in Table 2). All counts are an average of at least five embryos. Statistically significant (P < 0.001) comparisons are indicated with brackets and three asterisks. White circles indicate WT data and black circles the appropriate mutant data as indicated in key under panel A. All data were first analyzed for normality using the Shapiro–Wilk test. Data in G is not normally distributed and so a Wilcoxon–Mann–Whitney test was performed. Data sets in H–K are normally distributed and so the F-test for equal variances was performed, followed by a type 2 Student’s t-test (for equal variances). P-values are provided in Table 2. (L–Q, L’) Lateral line primordium phenotypes examined either by hmx3a expression (L’, M, N, Q) or live (L, O, P) at 27 hpf. (R–AI, R’, U’) Ear phenotypes examined either by hmx3a expression at 27 hpf (R, S, U’, W), live at 4 d (R’, T–V), pax5 expression at 24 hpf (X–AA) or phalloidin staining at 4 d (AB–AI). (A–K). There is no change in the number of spinal excitatory neurons in hmx3aSU42 (B and G) and hmx3asa23054 (C and H) and hmx2SU39 (F and K) mutant embryos compared to WT (A). In contrast, there is a statistically significant reduction in hmx3aSU3 (D and I) and hmx2;hmx3aSU44 (E and J) mutant embryos. (L–Q, L’). At 27 hpf, the tip of the lateral line primordium (black dotted line, L) has reached somite 10 (S10) in WT embryos (L and L’). This rate of migration is unchanged in hmx3aSU42, hmx3asa23054, and hmx2SU39 mutant embryos (M, N, Q). (O and P) In contrast, the lateral line primordium fails to migrate in hmx3aSU3 (O) and hmx2;hmx3aSU44 (P) mutant embryos. Instead, it is stalled adjacent to somites one to four (S4, somite 4). (R, S, U’, W) hmx3a expression in the ear (inside white dotted lines) and in presumptive neuroblasts anterior to the ear (white arrowheads) is unchanged in hmx3aSU42 (S) and hmx2SU39 (W) mutants, compared to WT embryos (R), but is severely reduced in both the presumptive neuroblasts anterior to the ear and the anterior ear (black arrowhead) in hmx3aSU3 mutants (U’). (T) hmx3asa23054 mutants show incompletely penetrant, variable otolith fusion phenotypes, ranging from no fusion (like WT ear in R’), through incomplete fusion (T), to complete fusion, like that observed at full penetrance in hmx3aSU3 (U) and hmx2;hmx3aSU44 (V) mutant embryos. (X–AA) The expression of pax5 in the anterior ear (inside black dotted lines) is unchanged in hmx2SU39 (AA) mutants, compared to WT embryos (X), but is severely reduced (blue arrowhead) in both hmx3aSU3 (Y) and hmx2;hmx3aSU44 (Z) mutants. (AB–AI) The three cristae of the ear (white asterisks) form normally in WT (AB), hmx3aSU3 (AC), hmx2;hmx3aSU44 (AD), and hmx2SU39 (AE) mutants. In contrast, the spatially distinct anterior (utricular, red arrow) and posterior (saccular, white arrow) maculae are unchanged in hmx2SU39 (AI) mutants, compared to WT embryos (AF), but are fused and are located in a more medio-ventral position (white cross) in hmx3aSU3 (AG) and hmx2;hmx3aSU44 (AH) mutants. However, there are no obvious differences between hmx3aSU3 and hmx2;hmx3aSU44 mutants. Bar, 50 µm (A–F), 30 µm (L–W), 20 µm (X–AA), 60 µm (L’, R’, U’, AB–AI). Panels X, Y, AB, AC, AF, and AG are reproduced from Hartwell et al. (2019) as per the Creative Commons Attribution (CC BY) license at PLoS Genetics.
|
