|
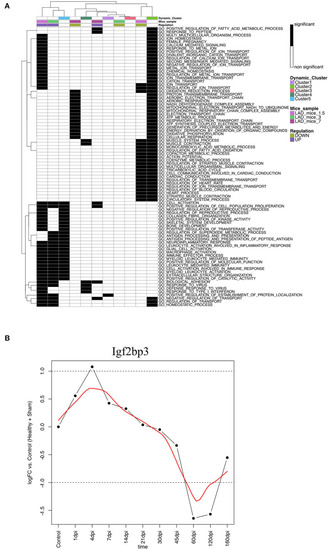
(A) Heatmap of the Gene Ontology biological processes terms that are significantly regulated in the zebrafish dynamic clusters and the neonatal mice samples. Dynamic clusters and neonatal mice samples were hierarchically clustered based on their significantly regulated gene sets. The black and white coded bar represents whether the given term is significantly regulated or not. The color coded bars depict the different mice samples, the up- and down-regulated terms and the dynamic zebrafish clusters. (B) Differential expression (log2FC) of the gene Igf2bp3 in the zebrafish time series. The red line describes the trend of the log2FC and the black line is a straight connection between time points. The dotted line represents the cut off for significant differential expression.
|