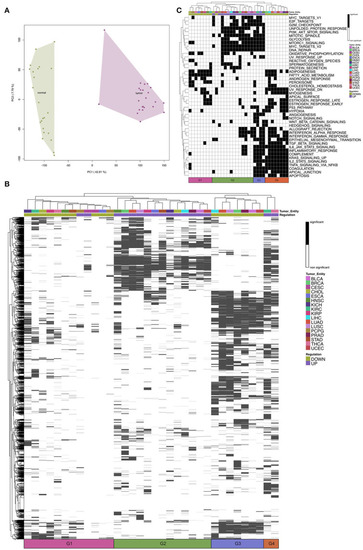
(A) A representative Principal Component Analysis of log2-expression (counts per million) of mRNA samples from The Cancer Genome Atlas Kidney Chromophobe (TCGA-KICH) cancer data set. Colors represent the conditions: tumor and normal. (B) Heatmap of Gene Set Enrichment Analysis of Gene Ontology biological processes for the tumor entities. Tumor entities and gene sets were hierarchically clustered based on Euclidean distance. The color bar represents whether the given term is significantly regulated. The black and white coded bar represents whether the given term is significantly regulated or not; the color coded bars depict the different tumor entities with the given abbreviation (see Supplementary Table 1) and the up- and down-regulated terms. (C) Heatmap of Gene Set Enrichment Analysis of Hallmarks of Cancer for the tumor entities. Tumor entities and gene sets were hierarchically clustered based on Euclidean distance. The black and white coded bar represents whether the given term is significantly regulated or not; the color coded bars depict the different tumor entities with the given abbreviation (see Supplementary Table 1) and the up- and down-regulated terms.
|
