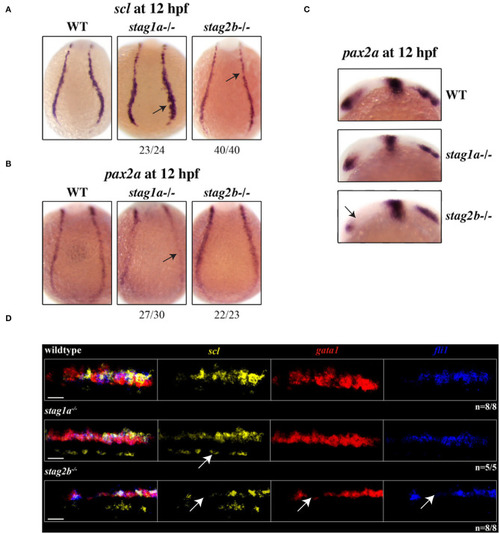
stag1a and stag2b mutations affect cell identity in the posterior lateral mesoderm at 12 hpf. (A)scl expression in whole-mount embryos at 12 hpf, posterior views of the PLM; dorsal to the top. In stag1anz204 homozygous mutant embryos scl expression is expanded. In stag2bnz207 homozygous mutant embryos, scl expression is reduced. Changes in expression are marked by arrows and the number of embryos is indicated below each panel. (B)pax2 expression in whole-mount embryos at 12 hpf, posterior views of the PLM; dorsal to the top. In stag1anz204 homozygous mutant embryos, pax2 expression in the PLM is markedly reduced. In stag2bnz207 homozygous mutant embryos, pax2 expression is comparable to wild type. Changes in expression are marked by arrows and the number of embryos is indicated below each panel. (C)pax2 expression in whole-mount embryos at 12 hpf, lateral views of the head region; anterior to the left. Anterior pax2 expression is specifically reduced in the optic stalk of stag2bnz207 homozygous mutant embryos. (D) Multiplexed in situ HCR of scl (Alexa Fluor 488, false color yellow), gata1 (Alexa Fluor 594, false color red), and fli1 (Alexa Fluor 647, false color blue) expression at 15 hpf. High magnification maximum intensity projections of a single PLM stripe; posterior views with anterior to the left. Expression domains of scl broadly overlap gata1 and fli1 in all embryos. Ectopic scl expression, indicated by white arrow, in stag1anz204 homozygous mutant embryos does not overlap gata1 or fli1 expression domains. In stag2bnz207 homozygous mutant embryos, expression of all three markers is reduced. Scale bars are 10 μm. The number of embryos analyzed is indicated below the respective panels.
|
