FIGURE

Fig. 3

ID
ZDB-FIG-201209-23
Publication
Høgset et al., 2020 - In vivo biomolecular imaging of zebrafish embryos using confocal Raman spectroscopy
Other Figures
All Figure Page
Back to All Figure Page
Fig. 3

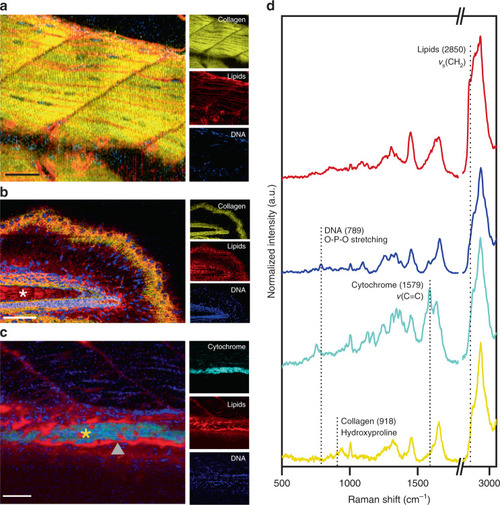
High-resolution confocal Raman spectroscopic imaging for anatomical tissue characterization.

Confocal Raman spectroscopic imaging (cRSI) was used to image tissue regions of interest at 3 days post fertilization, with a spatial resolution of 0.5–1 µm. Univariate analysis was performed by integrating over a wavenumber range corresponding to relevant biomolecules: collagen-rich regions at 918 ± 20 cm−1 (shown in yellow), DNA-rich regions at 789 ± 10 cm−1 (shown in blue), lipid-rich regions at 2850 ± 10 cm−1 (shown in red), cytochrome-rich regions at 1579 ± 15 cm−1 (shown in cyan). a A representative image of the dorsal muscle tissue, from three independent cRSI scans (N = 3). Scale bar: 40 µm. b An exemplar scan of the tail tissue of a single embryo (N = 1), with the white asterisk indicating the notochord. Scale bar: 50 µm. c An exemplar scan of the developing gut of a single embryo (N = 1), with the orange asterisk marking the gut lumen and the grey triangle points indicating the gut lining. Scale bar: 40 µm. d Exemplar Raman spectra obtained from regions of intense univariate signal, with the labeled peaks used for univariate analysis.

Expression Data

Expression Detail
Antibody Labeling
Phenotype Data

Phenotype Detail
Acknowledgments
This image is the copyrighted work of the attributed author or publisher, and ZFIN has permission only to display this image to its users. Additional permissions should be obtained from the applicable author or publisher of the image. Full text @ Nat. Commun.