
Figure 1
- ID
- ZDB-FIG-201130-73
- Publication
- Lu et al., 2020 - Generation and Application of the Zebrafish heg1 Mutant as a Cardiovascular Disease Model
- Other Figures
- All Figure Page
- Back to All Figure Page
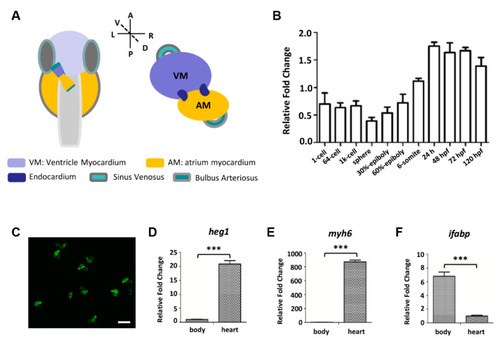
The expression level of |
| Genes: | |
|---|---|
| Fish: | |
| Anatomical Terms: | |
| Stage Range: | 1-cell to Day 5 |