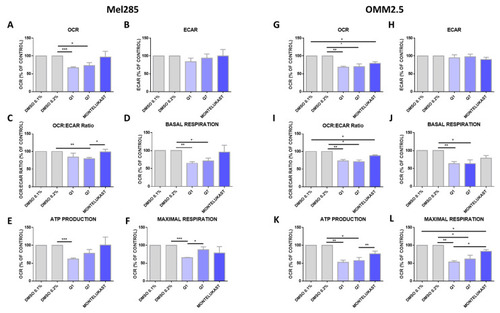
Quininib analogues inhibit oxidative phosphorylation, but not glycolysis, following 24 h treatment in Mel285 and OMM2.5 cell lines. Analysis of cellular metabolism in Mel285 (A–F) and OMM2.5 (G–L) UM cell lines. Oxygen consumption rate (OCR), a measure of oxidative phosphorylation, was evaluated in Mel285 (n = 5) (A) and OMM2.5 (n = 4) (G) cells using the Seahorse Biosciences XFe24 analyser following 24 h treatment with 20 μM of test compound or DMSO control. (A) 20 μM quininib (Q1) and 20 μM 1,4-dihydroxy quininib (Q7) significantly reduced OCR in Mel285 cells versus DMSO control. (G) 20 μM quininib, 1,4-dihydroxy quininib, and montelukast significantly reduced OCR in OMM2.5 cells versus DMSO control. Extracellular acidification rate (ECAR), a measure of glycolysis was evaluated in Mel285 (B) and OMM2.5 cells (H) following 24 h treatment. OCR:ECAR ratio was measured in Mel285 (C) and OMM2.5 (I) cells following 24 h treatment. Basal respiration was significantly reduced in Mel285 (D) and OMM2.5 (J) cells following 24 h treatment with quininib analogues at 20 μM. (E) ATP production was significantly reduced in Mel285 cells following 24 h treatment with quininib. (K) ATP production was significantly decreased in OMM2.5 cells following 24 h treatment with quininib and 1,4-dihydroxy quininib. (F) Maximal respiration was significantly reduced in Mel285 cells following 24 h treatment with quininib. (L) Maximal respiration was significantly reduced in OMM2.5 following 24 h treatment with quininib, 1,4-dihydroxy quininib, and montelukast. Data are expressed as mean + SEM. Statistical analysis was carried out using a paired t-test to compare within the same cell line. Data was normalised to cell number, as assessed by crystal violet assay. * p < 0.05; ** p < 0.01; *** p < 0.001.
|
