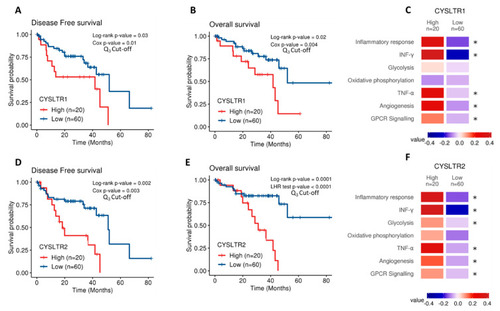
Analysis of CYSLTR1/CYSLTR2 expression and UM patient survival from The Cancer Genome Atlas (TCGA). Kaplan–Meier survival curves demonstrate a statistically significant relationship between high (red) CYSLTR1 expression and disease-free survival (A) (n =80; Log-rank; p = 0.03; HR 1.05; 95% CI 1.03–1.07) or overall survival (B) (n = 80; Log-rank; p = 0.02; HR 1.06; 95% CI 1.04–1.08) in UM patients. Low CYSLTR1 expression is shown in blue. Similarly, Kaplan–Meier survival curves demonstrate a statistically significant relationship between high (red) CYSLTR2 expression and disease-free survival (D) (n =80; Log-rank; p = 0.002; HR 1.35; 95% CI 1.25–1.45), or overall survival (E) (n =80; Log-rank; p = 0.0001; HR 1.01; 95% CI 1–1.02) in UM patients. Low CYSLTR2 expression is shown in blue. The third quartile was used as the cut-off point for high versus low expression for all Kaplan–Meier survival curves. Both Log-rank p-values (categorical variable) and Cox p-values (continuous variable) were calculated and are displayed for (A,B,D). Log-rank and likelihood ratio (LHR) test p-values were calculated and are displayed for (E). Samples were scored using gene expression profiles and categorized into high and low CYSLTR1 (C) and CYSLTR2 (F) expression using the third quartile as cut-off. Expression profiles of interest were manually selected from the Molecular Signatures Database (MSigDB) which includes gene sets from Hallmarks and Biocarta curated pathways. Colour values correspond to the median values of the enrichment scores. Patient tumours with high expression of CYSLTR1 show a corresponding significantly altered expression for the terms corresponding to Inflammatory Response, INF-γ, TNF-α, Angiogenesis and GPCR signalling (C) (* p < 0.05). Samples with high expression of CYSLTR2 show an associated significantly altered expression for the terms Inflammatory Response, IFN-γ, Glycolysis, TNF-α, Angiogenesis and GPCR signalling (F) (* p < 0.05). Differences were assessed using a non-parametric Wilcoxon test. Differences were considered statistically significant when p-value < 0.05.
|
