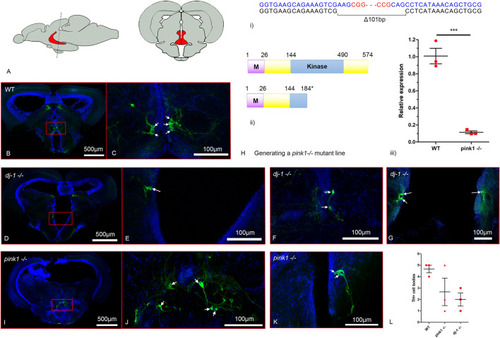
Reduction of dopaminergic neurons in the posterior tuberculum of PD zebrafish. Immunohistochemical detection of Tyrosine hydroxylase (Th) in dj-1−/− and pink1−/− brains. A section through the posterior tuberculum (pT) was identified based on the shape of the brain according to Wulliman et al. (1996). The large pear-shaped Th-positive cells located next to the ventricle in the pT have previously been identified as part of the zebrafish dopaminergic system projecting to the striatum (Rink and Wullimann, 2001). Therefore, the pear-shaped Th-positive cells identified in the periventricular pT location were counted. (A) Lateral view of the adult zebrafish brain (left) and cross-section through the adult zebrafish brain (right). Highlighted in red is the pT. (B-G,I-K) Immunofluorescently labelled Th-positive cells (green) in the pT of wild-type, dj-1−/− and pink1−/− zebrafish (n=3 biological replicates) at 12 months post-fertilisation (mpf). Hoechst staining of nuclei is in blue. Arrows indicate the cell bodies of the paraventricular DA neurons. (B) Th-positive cells in a section through the pT (red box) of a wild-type brain. (C) A close-up of the Th-positive cells in the pT from A. (D) Th-positive cells in a section through the pT (red box) of a dj-1−/− brain. (E) A close-up of the Th-positive cells in the pT from D. (F,G) Close-ups of Th-positive cells in the pT of two further dj-1−/− brains. (H)(i) CRISPR/Cas9 target sequences (blue), PAM sites (red) and the 101 bp deletion generated in exon 2 of pink1 (at position 591 of NM_001008628). (ii) Wild-type Pink1 (above) and the truncated Pink1 protein (below) predicted in the pink1 mutant. (iii) qRT-PCR analysis comparing pink1 expression in brains extracted from pink1−/− zebrafish (n=4, biological replicates) and their wild-type siblings (n=3) at 16 wpf. Student’s t-tests (two-tailed, unpaired) were used to compare the dCt values for pink1−/− and wild-type samples. Data are mean±s.e.m., ***P<0.001. (I) Th-positive cells in a section through the pT (red box) of a pink1−/− brain. (J) A close-up of the Th-positive in the pT from I. (K) A close-up of the Th-positive cells in the pT of a further pink1−/− brain. (L) Counts of Th-positive cell bodies seen in the pT (single 100 µm section) for wild-type, dj-1−/− and pink1−/− zebrafish (n=3 biological replicates) at 12 mpf.
|
