
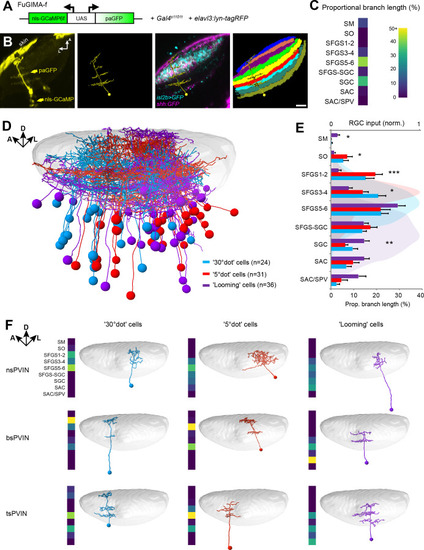
Figure 5—figure supplement 1.
- ID
- ZDB-FIG-201017-9
- Publication
- Förster et al., 2020 - Retinotectal circuitry of larval zebrafish is adapted to detection and pursuit of prey
- Other Figures
-
- Figure 1.
- Figure 2—figure supplement 1.
- Figure 2—figure supplement 1.
- Figure 3—figure supplement 1.
- Figure 3—figure supplement 1.
- Figure 3—figure supplement 2.
- Figure 4—figure supplement 1.
- Figure 4—figure supplement 1.
- Figure 5—figure supplement 1.
- Figure 5—figure supplement 1.
- Figure 5—figure supplement 2.
- Figure 5—figure supplement 3.
- Figure 6.
- Figure 7.
- Figure 8—figure supplement 1.
- Figure 8—figure supplement 1.
- All Figure Page
- Back to All Figure Page
( |