
Figure 3
- ID
- ZDB-FIG-201012-49
- Publication
- Huang et al., 2020 - Collagen-rich omentum is a premetastatic niche for integrin α2-mediated peritoneal metastasis
- Other Figures
-
- Figure 1
- Figure 1—figure supplement 1.
- Figure 1—figure supplement 2.
- Figure 1—figure supplement 3.
- Figure 2
- Figure 2—figure supplement 1.
- Figure 2—figure supplement 2.
- Figure 3
- Figure 3—figure supplement 1.
- Figure 4
- Figure 4—figure supplement 1.
- Figure 5
- Figure 5—figure supplement 1.
- Figure 5—figure supplement 2.
- Figure 6.
- Figure 7
- Figure 7—figure supplement 1.
- Figure 7—figure supplement 2.
- Figure 7—figure supplement 3.
- Figure 8.
- All Figure Page
- Back to All Figure Page
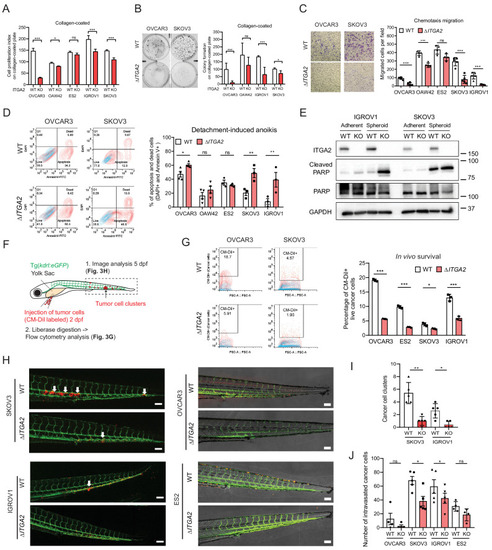
(A) Cell proliferation index of WT and ΔITGA2 cells in collagen-coated plate. (B) Anchorage-dependent colony formation assay for WT and ΔITGA2 cells on collagen-coated plate after 7 days incubation. Bar chart represents the mean ± SD of total colony counts. (C) Chemotaxis cell migration assay and quantification of cell migration (24 hr). Scale bar 200 μm. (D) Cell detachment-induced apoptosis (anoikis) assay. WT and ΔITGA2 cells stained with Annexin V-FITC and DAPI after 3–5 days of cultivation in ultra-low attachment plate to identify apoptotic dead cells (FITC+/DAPI+). Mean ± SD (*p<0.05) from two independent experiments. (E) Western blot shows increased cleaved PARP in the KO compared to WT cells under non-adherent spheroid condition. (F) Scheme of tumor cells transplant model in Tg(kdrl:eGFP) zebrafish. CM-Dil labeled cancer cells were transplanted into zebrafish at two dpf (days post fertilization). (G) At five dpf, fish were enzymatically dissociated to single cells and analyzed in vivo survival of cancer cells by flow cytometry. Representative counter plot shows the percentage of CM-Dil+ cancer cells. Bar chart summarizes data from n = 5 fish per group. (H) Representative confocal images of transplanted fish (n = 5 per group) showing the tumor cluster formation in proximity of the circulatory loop (white arrow) at five dpf. Scale bar 100 μm. (I) Numbers of cluster formation and (J) single cells in tail vein were counted and represented as mean ± SD (unpaired Student’s t-test, *p<0.05). |