
FIGURE
Figure 1—figure supplement 2.
- ID
- ZDB-FIG-201012-43
- Publication
- Huang et al., 2020 - Collagen-rich omentum is a premetastatic niche for integrin α2-mediated peritoneal metastasis
- Other Figures
-
- Figure 1
- Figure 1—figure supplement 1.
- Figure 1—figure supplement 2.
- Figure 1—figure supplement 3.
- Figure 2
- Figure 2—figure supplement 1.
- Figure 2—figure supplement 2.
- Figure 3
- Figure 3—figure supplement 1.
- Figure 4
- Figure 4—figure supplement 1.
- Figure 5
- Figure 5—figure supplement 1.
- Figure 5—figure supplement 2.
- Figure 6.
- Figure 7
- Figure 7—figure supplement 1.
- Figure 7—figure supplement 2.
- Figure 7—figure supplement 3.
- Figure 8.
- All Figure Page
- Back to All Figure Page
Figure 1—figure supplement 2.
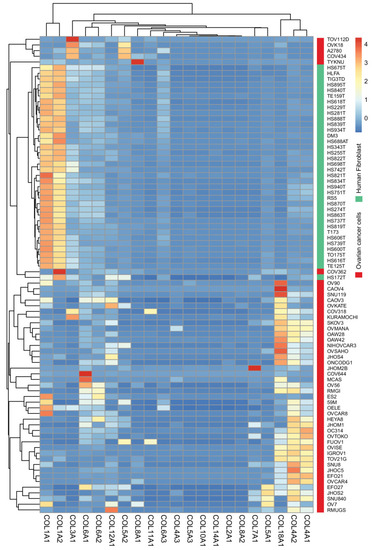
Unsupervised hierarchical cluster analysis and heat map visualization for expression of collagen-encoding genes among EOC cell lines (n = 47) and human fibroblast derived from various tissue origins (n = 37) using the CCLE dataset. |
Expression Data
Expression Detail
Antibody Labeling
Phenotype Data
Phenotype Detail
Acknowledgments
This image is the copyrighted work of the attributed author or publisher, and
ZFIN has permission only to display this image to its users.
Additional permissions should be obtained from the applicable author or publisher of the image.
Full text @ Elife