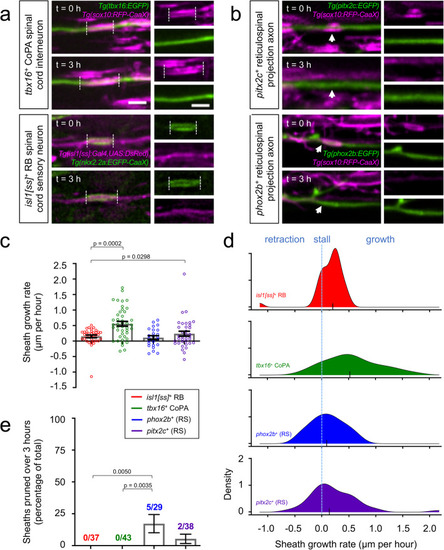
Individual sheath extension rates and pruning frequencies are axon subtype-specific.a-b Lateral view images of the larval spinal cord show sheath extension (a) and sheath pruning (b) during a 3-h time course. Transgenic reporter expression (indicated) marks individual axons or oligodendrocyte membranes. Dashed lines illustrate individual sheath lengths and arrowheads denote sheath pruning events. Images are confocal maximum z-projections with dorsal up and anterior left. Scale bar = 3 μm. c-d Plots show mean growth rates (c) and distributions of individual sheath growth rates (d). For (c), error bars represent the mean ± SEM. For (d), the y-axis approximates the density of data points that exhibited the corresponding growth rate. Larger y-values represent a larger proportion of data points exhibiting this growth rate. Black ticks indicate medians. n (# of sheaths) = 24 (phox2b+), 43 (tbx16+), 36 (pitx2c+), 37 (isl1[ss]+). e Quantification of the percentage of total sheaths that pruned during a 3-h time course grouped by axon subtype. n (sheaths) = 29 (phox2b+), 43 (tbx16+), 38 (pitx2c+), 37 (isl1[ss]+). Overall chi-square test of difference in percent pruning = 0.0025. Pairwise p-values were generated using Dunn’s multiple comparisons (c) or using Tukey-adjusted pairwise comparisons (e)
|
