|
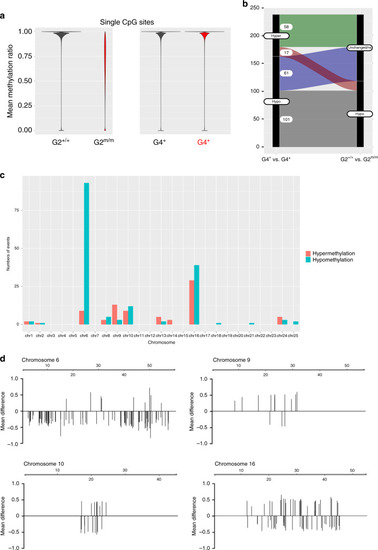
Dynamic changes of DNA methylation patterns in the G4 generation.a Mean methylation ratios of CpG dinucleotides in sperm DNAs of G2 dnmt1+/+ and dnmt1m/m animals (left panel), and genotypically wild-type (dnmt1+/+) males of the G4 generation giving rise to off-spring with (G4*) or without (G4+) impaired larval T cell development when crossed to wild-type females (right panel). b History of methylation of DMRs distinguishing G4+ and G4* animals. The y-axis gives the number of DMRs that are either hypermethylated or hypomethylated in sperm DNA of in G4* versus G4+ animals. These DMRs were either indistinguishable in sperm of the G2 generation or were hypomethylated in G2m/m versus G2+/+ animals. c, d Non-random distribution of DMRs in the genome of sperm of G4* relative to G4+ animals. Most DMRs represent hypomethylated sites c. Distribution of DMRs across the 4 most affected chromosomes (scale in Mb); the mean methylation differences are indicated; positive values indicate hypermethylation of DMRs in G4* sperm, negative values indicate hypomethylation of DMRs in G4* sperm (d). Source data are provided as Source Data file.
|