|
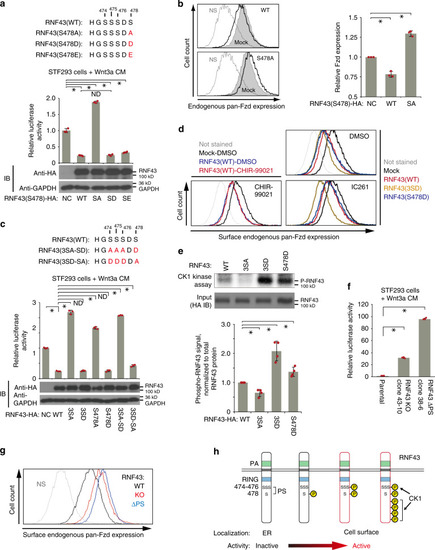
Multi-step phosphorylation is required for RNF43 function.a–c The role of a priming phosphorylation was investigated using STF-Luc assay (a, c) and flow cytometric analysis (b) using RNF43 mutants. Luciferase activity or surface Fzd level in empty vector-transfected (NC) or mock cells was set to 1. Grey or black lines, or grey fills indicate not stained, RNF43 stably expressed or mock cells, respectively. Characters shown in red indicate amino acids after substitution (a, c). d Surface expression of Fzd was examined via flow cytometric analysis following addition of kinase inhibitors (GSK-3β, CHIR-99021; CK1, IC261). e, Phosphorylation of RNF43 and mutant forms was examined by an in vitro kinase assay with CK1/2. Phospho-RNF43 levels were normalised to total RNF43 protein levels and normalised phospho-RNF43(WT) levels were set to 1. f The effects of a loss of endogenous RNF43 (KO) or removal of the RNF43 phospho-switch (ΔPS; similar to serine-rich region (SRR)2 and SRR2-2 in Supplementary Fig. 1f) were examined in STF293 cells using a STF-luciferase assay. The luciferase activity in parental STF293 cells was set to 1. g Surface Fzd expression on RNF43 KO or ΔPS STF293 cells was evaluated using flow cytometry with pan-Fzd antibodies (Abs). h Schematic of localisation-dependent RNF43 activation via multi-step phosphorylation. RNF43 activity is acquired via phosphorylation at a post-ER stage during or after protein trafficking toward the cell surface. Bar graphs and error bars in this figure represent mean ± standard deviation (sd) of at least three biologically independent experiments. Red circles indicate individual values of each sample. The P values for the indicated comparisons were determined by one-way ANOVA (P < 0.05). n = 3 (a–c, f), n = 4 (e) biologically independent samples. Asterisks or ND indicates significant or no significant difference in indicated comparisons, respectively. All FACS data in this figure was acquired and displayed with same strategy shown in Supplementary Fig. 1g. Each coloured line indicates the property of RNF43 expressing in cells (d, g).
|