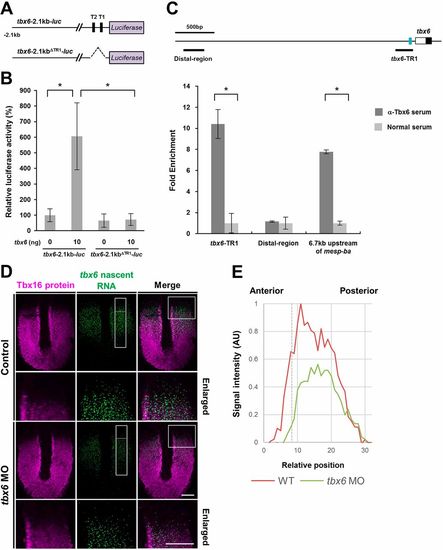
Transcriptional autoregulatory loop of tbx6: Tbx6 proteins are associated with T1 and T2 sites and activate the transcription of tbx6 in the anterior PSM. (A) Schematic illustrations showing the reporter genes used in the luciferase assay. (B) Luciferase assay showing the effects of tbx6 on reporter gene activities in HEK293T cells. The amounts of plasmids used for transfection are shown under each bar. The average normalized firefly luciferase activity with pCS2+ (mock) alone was set at 100%; error bars represent standard deviations. The differences of relative luciferase activity were statistically evaluated using Student's t-test. *P<0.05. Three independent experiments were performed to confirm the reproducibility. (C) ChIP assay revealed that Tbx6 proteins are preferentially associated with the TR1. Schematic representation of zebrafish tbx6 genomic locus is shown. The white box indicates the 5′UTR, the black box indicates the coding region in the first exon and the blue rectangle represents the location of TR1. The position of primers used for qPCR analysis is shown below the genomic locus. As a positive control, the genomic region located 6.7 kb upstream of mesp-ba, which was previously identified as a Tbx6-associated genomic region (Windner et al., 2015), was used. As a negative control, the genomic region that is located 3.1 kb upstream of tbx6 was used. ChIP analysis was performed twice from independent dissected posterior tissues of embryos at the 18- to 22-somite stage. qPCR analysis was carried out at least three times for each precipitated ChIP sample. (D) The expression domain of tbx6 nascent transcripts in tbx6 knockdown embryos. The expression domain of Tbx16 protein was co-stained to precisely define the posterior PSM. Dorsal view of flat-mounted species at the 10-somite stage. tbx6 knockdown embryos clearly showing segmental defects were used for analysis. Images around the anterior PSM (boxed regions) are shown enlarged. Scale bars: 100 µm. (E) Quantification of signal intensity of tbx6 nascent transcripts in the PSM of control and tbx6 knockdown embryos. In the boxed areas shown in D, the intensity of tbx6 nascent RNA signals along the anterior-posterior axis was measured using ImageJ, and the relative intensity was compared. Dashed line represents the anterior border of the expression domain of Tbx16.
|
