|
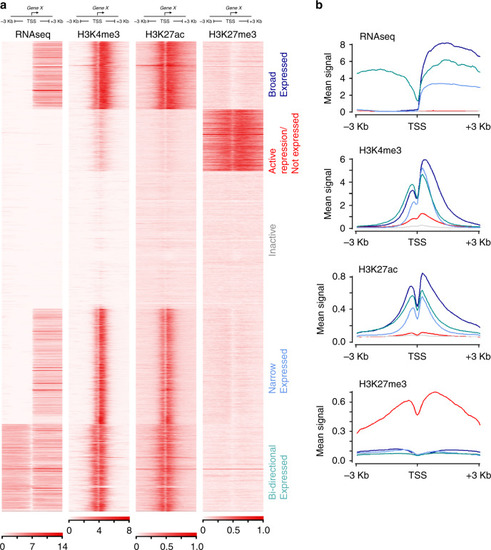
Classification of major promoter states.a Clustered heatmaps surrounding the transcriptional start sites (TSS + /− 3 kb) of 19,791 annotated genes. The example shown is for adrenal. One replicate is shown for each data type for simplicity. Replicates across all tissues were near identical. Two minor variations on this pattern were detected in RPE (Supplementary Fig. 2) and the liver, lung and brain (Supplementary Fig. 3). b Mean signal levels for the genes clustered in (a). Traces are coloured according to the text colour in (a). Broad expressed genes show approximately double the level of transcription and twice the width of H3K4me3 and H3K27ac marks compared with narrow expressed genes.
|