
Figure 3
- ID
- ZDB-FIG-200817-29
- Publication
- Fulton et al., 2020 - Axis Specification in Zebrafish Is Robust to Cell Mixing and Reveals a Regulation of Pattern Formation by Morphogenesis
- Other Figures
- All Figure Page
- Back to All Figure Page
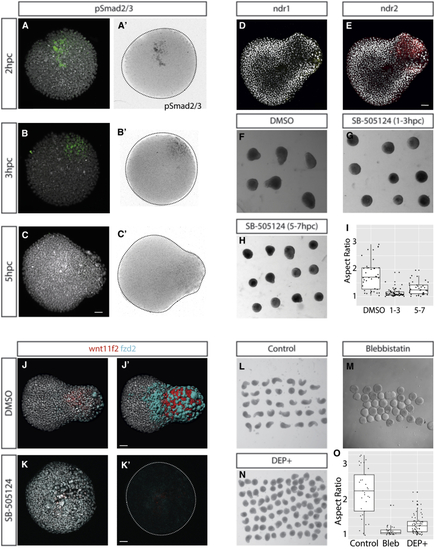
Nodal Signaling Is Upstream of PCP-Driven Convergence and Extension, which Drives Elongation (A–C) The first signaling event that polarizes to a single point within the pescoid is that of Nodal signaling, demonstrated through (A–C) polarization of phospho-Smad 2/3 activity. This is shown in composite color images and as pSmad2/3 signal inverted images (A’–C’; 2 hpc n = 4/8; 3 hpc n = 5/8; 5 hpc n = 4/6; total with polarized signal/total imaged). (D and E) We also observe polarized (D) ndr1 and (E) ndr2 expression in the elongation at 5hpc ( (F–I) Treatment with the Nodal inhibitor SB-505124 between (G) 1 and 3 hpc inhibits elongation of the explants and (H) to a lesser extent when applied between 5 and 7 hpc when compared to controls at 7 hpc (F and I). (J) The PCP components (K and K’) Inhibition of Nodal signaling between 1 and 3 hpc results in loss of (L–O) Inhibition of convergence and extension movements using (M) blebbistatin or (N) injection at the one-cell stage of a dominant-negative dishevelled construct blocks elongation when compared to controls (L and O), further supporting that elongation is caused by convergence and extension movements. Elongation is demonstrated not be to be caused by polarized cell division in |