
- Title
-
Axis Specification in Zebrafish Is Robust to Cell Mixing and Reveals a Regulation of Pattern Formation by Morphogenesis
- Authors
- Fulton, T., Trivedi, V., Attardi, A., Anlas, K., Dingare, C., Arias, A.M., Steventon, B.
- Source
- Full text @ Curr. Biol.

Lineage and Spatial Pre-patterns Are Lost due to Extensive Cell Divisions and Cell Mixing (A–D’) Disassociation (A) and reaggregation (B) of explanted cells results in (E–F’) Number of cells in pescoids (E) counted based on image segmentation (black curve), as seen in images acquired on SPIM (F and F’). Dashed curves are estimates of the number of cells, starting from the number of spots segmented at t = 0, if all cells divided synchronously every 20 min (blue line) or only a random sub-population (<50%) of cells divided every 20 min (orange line). (F and F’) Cells in pescoid divide randomly with no preference for direction of division, leading to mixing of cells. (G–I’) Injecting embryos with fluorescent high-molecular-weight dextran at the 64-cell stage, (H–I) labeling marginal cells prior to making pescoids demonstrates that these labeled cells spread across the entire pescoid within (H’–I’) 5 h of explanting. These cells also show a high level of intermixing of labeled and unlabeled cells. n = 10, all demonstrating cell mixing. (G–I) Images shown as maximum projections. (I’) Shown as central 2-μm slice. (J–L’) This is also shown in pescoids injected at the one-cell stage with Kikume mRNA and then a small population of cells labeled by photo conversion at 1 hpc. Explants were reimaged at 3 hpc to assay for label mixing (n = 6 replicates, all demonstrating cell mixing). (K–K’) Images are shown as maximum projections at 1 and 3 hpc. (L–L’) spot detection of labelled and unlabelled cells in 3D rendering of (K–K’) demonstating cell mixing at 1 and 3 hpc. (N–Q’) HCR staining of animal cap explants and pescoids at 5 hpc reveals a similar expression of (R) This finding is further supported by (R and R’) clear expression of a Tbx16::GFP reporter in both animal caps (4/6; expression/imaged from heterozygous in-cross) and full pescoid explant at 7 hpc (2/4; expression/imaged from heterozygous in cross). Further replicates of labeling experiments (G–L) demonstrating cell mixing are shown in |
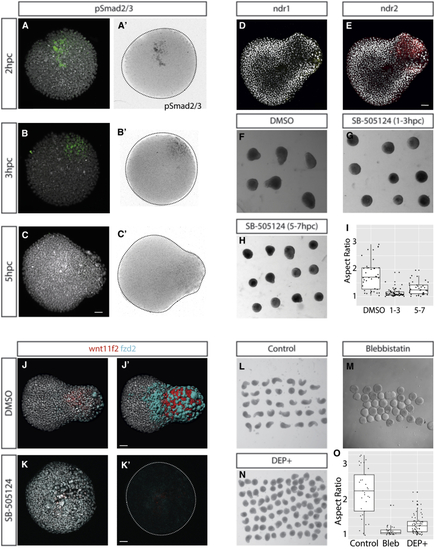
Nodal Signaling Is Upstream of PCP-Driven Convergence and Extension, which Drives Elongation (A–C) The first signaling event that polarizes to a single point within the pescoid is that of Nodal signaling, demonstrated through (A–C) polarization of phospho-Smad 2/3 activity. This is shown in composite color images and as pSmad2/3 signal inverted images (A’–C’; 2 hpc n = 4/8; 3 hpc n = 5/8; 5 hpc n = 4/6; total with polarized signal/total imaged). (D and E) We also observe polarized (D) ndr1 and (E) ndr2 expression in the elongation at 5hpc ( (F–I) Treatment with the Nodal inhibitor SB-505124 between (G) 1 and 3 hpc inhibits elongation of the explants and (H) to a lesser extent when applied between 5 and 7 hpc when compared to controls at 7 hpc (F and I). (J) The PCP components (K and K’) Inhibition of Nodal signaling between 1 and 3 hpc results in loss of (L–O) Inhibition of convergence and extension movements using (M) blebbistatin or (N) injection at the one-cell stage of a dominant-negative dishevelled construct blocks elongation when compared to controls (L and O), further supporting that elongation is caused by convergence and extension movements. Elongation is demonstrated not be to be caused by polarized cell division in |

PCP-Dependent Elongation Is Required for Regulating Exposure to BMP and Wnt Activity (A–F) Expression of (G–M, O–R, and T–W) The time course reveals the isolation of the BMP and Wnt domains to either end of the explant allows expression of hindbrain marker (G–I) (N, S, and X) Description of these profile quantitatively through normalization of the long axis of the explant and normalization of signal intensity between 0 and 1 (n = minimum 7 per condition; line represents mean). The lack of low BMP moderate Wnt/TCF domain can be observed in the central region of the explants compared to control. (N) displays a control profile, (S) displays the profile of a DEP+ explant, and (X) displays a profile of an explant treated with Blebbistatin. (N’, S’, and X’) The lack of low BMP moderate Wnt/TCF domains results in significantly altered patterns of |

Axial Patterning Can Occur in the Absence of Yolk (A–K) Explants of early embryonic blastomeres taken at the (A) 256-cell stage demonstrate elongation and mesendodermal induction visualized through expression of a (B–F) Tbx16::GFP reporter (n = 4/8; heterozygous in-cross) and (G–K) (L and M) At the opposite pole to (N) In the high (O) Germ cell markers (O and O’) Elongation is further quantified and shown to occur in a range of media in |