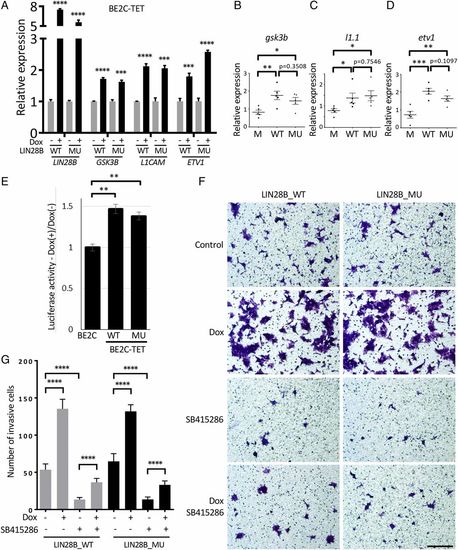
Expression of WT or mutant LIN28B reverses the cell invasion and migration defects induced by GSK3B inhibition. (A) qRT-PCR to detect LIN28B, GSK3B, L1CAM, and ETV1 expression in BE2C-TET cells that were either untreated or treated with 50-ng/mL doxycycline for 3 d. Values were normalized to EEF1A1, ACTB, and B2M and represent the means ± SD of triplicate experiments. (B–D) The expression of zebrafish gsk3b (B), l1.1 (C) and etv1 (D) mRNAs in EGFP;MYCN (M), LIN28B_WT;MYCN (WT), and LIN28B_MU;MYCN (MU) tumors was analyzed by qRT-PCR. Five independent tumors from 6-mo-old fish were analyzed for each group. Each dot represents the expression levels of the indicated gene normalized to EEF1A1. Horizontal bars indicate means ± SD. (E) The LIN28B- and ZNF143-binding sequences within the GSK3B promoter region were cloned upstream of the firefly luciferase reporter gene and transfected into BE2C or BE2C-TET cells expressing Flag-tagged LIN28B_WT (WT) or LIN28B_MU (MU) that were untreated or treated with doxycycline. A reporter construct encoding renilla luciferase under control of the cytomegalovirus promoter was cotransfected to normalize firefly luciferase values. Luciferase activities were measured 48-h posttransfection and expressed as a ratio of the cells treated with doxycycline to untreated controls. Values represent means ± SEM of triplicate experiments. (F and G) Transwell migration and invasion assay of the BE2C-TET cells untreated or treated with 50-ng/mL doxycycline or 25-μM GSK3B inhibitor SB415286. Cells were stained with 0.1% crystal violet (F), and the number of migrated cells through the membrane per field was plotted as means ± SD of triplicate experiments (G). (Scale bar, 100 µm.) All of the statistical analyses were performed using the two-tailed unpaired t test. *P < 0.05; **P < 0.01; ***P < 0.001; ****P < 0.0001.
|
