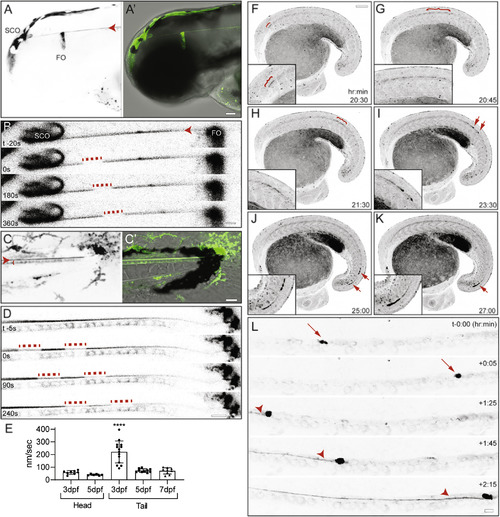
Dynamic Properties of the Reissner Fiber Revealed in Scospondin-GFPut24 Knockin Zebrafish (A) Inverted grayscale maximal Z projection of confocal stack of scospondin-GFPut24/+ embryo at 3 dpf. Expression in the subcommissural organ (SCO) and flexural organ (FO) in the head with Reissner fiber (red arrowhead; A). Merge of differential interference contrast (DIC) image and pseudocolored SCO-spondin-GFP expression (green; A’) is shown. Scale bar, 50 μm. (B) Inverted grayscale frames from a time-lapse confocal dataset from a scospondin-GFPut24/+ embryo head at 3 dpf. At time (t) = 0, a region was photobleached using a short, high-energy pulse from a 488-nm solid state laser, which allowed for manual tracking of the movement of the bleached region from rostral to caudal. Scale bar, 10 μm. (C) Inverted grayscale maximal Z projection of confocal stack of scospondin-GFPut24/+ embryo tail at 3 dpf. The Reissner fiber (red arrowhead) and floor plate (red bracket) are labeled with GFP (C). Merge of DIC image and pseudocolored SCO-spondin-GFP expression (green; C’) is shown. Scale bar, 20 μm. (D) Inverted grayscale frames from a time-lapse confocal dataset from a scospondin-GFPut24/+ embryo head at 3 dpf. At time (t) = 0, two regions were photobleached as in (B), which allowed for manual tracking of the movement of the bleached region from rostral to caudal. Scale bar, 10 μm. (E) Average velocity as nanometers (nm) per second (s) were calculated manually for multiple embryos at 3, 5, and 7 dpf in experiments depicted in (B) and (D) (n = 13, 9, and 8, respectively). The average velocity for each individual embryo was plotted as boxplots (mean ± SD; ∗∗∗∗p < 10−4). (F–K) Single frames from a time-lapse confocal dataset taken during tail bud development (20–30 h post-fertilization; see Video S2) presented as inverted grayscale maximal Z projections. At the first indication of Reissner fiber formation (F–H), red brackets highlight fibers of SCO-spondin-GFP, which travel in a caudal direction. As development of the Reissner fiber roceeds (I–K) we observed the fiber could also accumulate as a bolus SCO-spondin-GFP material (red arrows), which could then travel rapidly in a rostral to caudal direction. Insets in the lower left-hand side of each panel are digitally enlarged portions of the region containing SCO-spondin-GFP-labeled material. Scale bars, 100 μm in main and 50 μm in inset. Time stamp is h:min post-fertilization. (L) Frames from a time-lapse confocal dataset taken during tail bud development (20–22 h post-fertilization; see Video S2) presented as inverted grayscale maximal Z projections. Red arrows highlight SCO-spondin-GFP-labeled bolus material, although red arrowheads indicate bolus material leading the Reissner fiber. Scale bar: 10 μm. See also Figure S3 and Video S1, S2, S3, S4, and S5.
|
