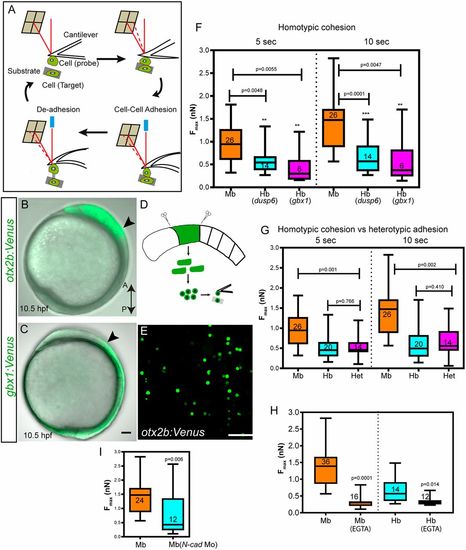
Differential adhesion as a mechanism of cell sorting at the MHB. (A) Schematic representation of atomic force microscope-based single cell force spectroscopy (AFM-SCFS). A cell attached to the cantilever is brought into contact with another cell placed on the substrate (approach). During cell-cell contact, adhesion molecules form bonds in the contact zone. After a predefined contact time, the cantilever is retracted, which results in the breaking of bonds between the two cells (retract); thus, the maximum force (Fmax, measured in nanonewtons, nN) required to separate the two cells can be measured (redrawn based loosely on Krieg et al., 2008). (B,C) Lateral views of otx2b:Venus (midbrain, Mb) and gbx1:Venus (hindbrain, hb) embryos at 10.5 hpf; arrowheads indicate the prospective MHB. (D,E) The embryos were dissociated at the tail bud stage and a single-cell suspension for SCFS was made by mechanical trituration. (F,G) Midbrain cells (otx2b:Venus-positive) showed more cohesion than hindbrain cells (gbx1 or dusp6 positive) at the 5 s and 10 s time points (homotypic adhesion), while heterotypic adhesion between Mb with Hb cells was lower than that of Mb-Mb cohesion. The P values (comparison between Mb and Hb; Mann–Whitney U-test) for the two time points are shown on the graph; n represents the number of cell pairs analyzed for each condition. (H) Depletion of Ca2+ using 5 mM EGTA addition dramatically reduced cell-cell cohesion between Mb and Hb cells. (I) Depletion of N-cadherin using a morpholino-mediated knockdown (N-cad Mo) reduced cell-cell cohesion between otx2b-positive cells (midbrain cells); n represents the number of cell pairs analyzed and is indicated within the box and whisker plot. All AFM-based experiments were repeated at least three times. Data are shown using box and whisker plots: the ends of the box are the upper and lower quartiles and the box spans the interquartile range; median is marked within the box; whiskers indicate maximum and minimum values.
|
