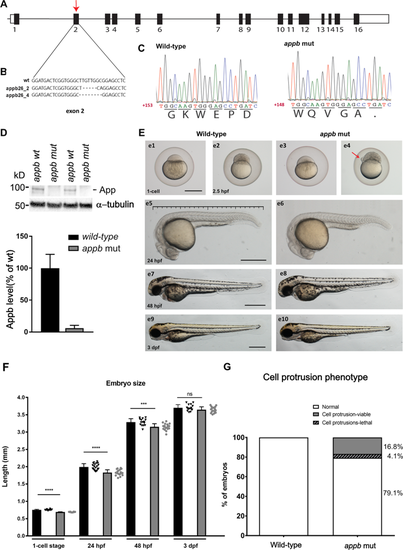
Characterization of the appb mutation. (A) Schematic representation of the coding (box) and non-coding regions (line) of the appb gene, indicating the mutation point in exon 2 (red arrow). (B) Nucleotide sequence surrounding the deletions (dashed line indicates missing nucleotides). (C) Sanger sequencing chromatogram of the 3´end of exon 2 in wild-type and appbmutants shows a premature stop (dot) in the translated protein sequence in mutants. (D) Western blot analysis of Appb expression in adult brain from wild-type (n = 4) and appb mutants (n = 4) using the in house-generated Appb-specific antibody (EER15) and α-tubulin as loading control. Quantification shown as percentage of wild-type. (E) Morphology of appbmutants and wild-type zebrafish embryos at one-cell stage to 3 dpf larvae (e1, e3, e5, e7, e9 indicates wild-type and e2, e4, e6, e8, e10 are appbmutants). Scale in e5 shows measurement of larvae. (F) Embryo size measurement at the 1-cell stage (wt, n = 10; appb26_2/26_2, n = 8), 24 hpf (wt, n = 20; appb26_2/26_2, n = 20), 48 hpf (wt, n = 10; appb26_2/26_2, n = 8), the size of the embryo was measured across the yolk. The total body length of 24 hpf (wt, n = 20; appb26_2/26_2, n = 20), 48 hpf (wt, n = 15; appb26_2/26_2, n = 19) and 3 dpf (wt, n = 15; appb26_2/26_2, n = 19) and 3 dpf (wt, n = 15; appb26_2/26_2, n = 19). Error bars are in SD and p–values calculated by t-test. Data points are given to the right of each bar with triangles (wt) or filled circles (appb mut). (G) Quantification of cell protrusion phenotype shown as percentage of all embryos. Wild-type (n = 418) and appb mutant (n = 465). Scale bar= 500 μm. *p < 0.05, **p < 0.01 and ***p < 0.001.
|
