|
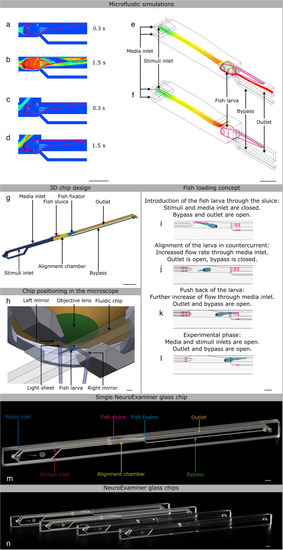
NeuroExaminer design and fabrication.a–d Simulation of the targeted stimulus injection at a volume flow rate of 0.1 µl/s with simultaneous supply of oxygen-enriched medium at 1 µl/s in a cross-sectional view in the closed a, b and open c, d NeuroExaminer versions at 0.3 and 1.5 s after the entry of the stimulus into the alignment chamber. The color-coded distribution shows the concentration (blue = 100% medium and red = 100% stimulus) in the mid-plane of the channel, and on the larval surface after impacting the larva. e, f 3D view of stimulus streamline patterns of injected stimuli (blue = 0 mm/s, red = 25 mm/s) in the closed e and open f system variant simulated assuming the same inflow volume currents as in a–d. The larva head experiences a homogeneous stimulus exposure in the closed system, whereas in the open system the stimulus is also directed outside of the device reducing the contact surface of the larva head with the stimulus solution. g 3D design of the closed system variant. h Schematic 3D view of the zebrafish larva positioned inside the fluidic chip and the light sheet microscope setup (see also Supplementary Fig. 1). i–l Illustration of the four-step loading concept. m A photo of the closed NeuroExaminer chip variant taken after thermal bonding. n The influence of the post treatment process on optical transparency illustrated by a photo comparing NeuroExaminer chips representing (from left to right) the open system before and after the combined chemical and thermal treatments and the closed system before and after the treatment. The scale bar is 1 mm throughout, except for g where it is 10 mm.
|