FIGURE

FIGURE 6

ID
ZDB-FIG-200619-21
Publication
Varga et al., 2020 - Tissue-Specific Requirement for the GINS Complex During Zebrafish Development
Other Figures
All Figure Page
Back to All Figure Page
FIGURE 6

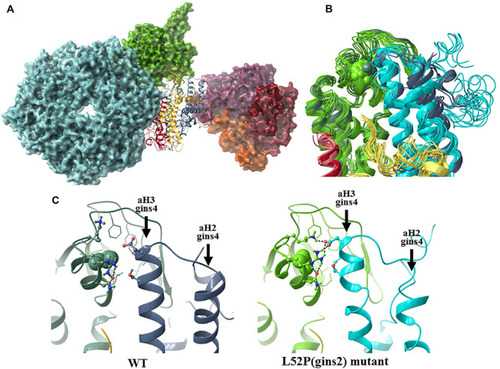
The structural consequences of the Gins2L52P mutation in the zebrafish GINS complex. (A)In silico generated model of the MCM-Cdc45-GINS-Ctf4 complex built using structures 3jc5 (Yuan et al., 2016), 4c8h (Simon et al., 2014), and the homology model of the zebrafish GINS complex created in this study. The MCM hexamer (cyan), Cdc45 (green), and the Ctf14 homotrimer (purple, red, and orange) are shown as surfaces, while GINS as a ribbon diagram (Gins1: yellow, Gins2: green, Gins3: red, Gins4: blue). (B) Superposition of the most populated cluster mid-structures (accounting for >90% of all structures of the equilibrium trajectory). Coloring of the Gins monomers is the same as before, darker shades are used for the wildtype, the lighter for the mutant structures (residue 52 of Gins2 shown in space-filling representation). (C) Detailed view of the site of the mutation, with a typical H-bonding motif also illustrated.

Expression Data

Expression Detail
Antibody Labeling
Phenotype Data

Phenotype Detail
Acknowledgments
This image is the copyrighted work of the attributed author or publisher, and ZFIN has permission only to display this image to its users. Additional permissions should be obtained from the applicable author or publisher of the image. Full text @ Front Cell Dev Biol