
Fig. 3
- ID
- ZDB-FIG-200615-30
- Publication
- Blume et al., 2020 - Microglia in the developing retina couple phagocytosis with the progression of apoptosis via P2RY12 signaling
- Other Figures
- All Figure Page
- Back to All Figure Page
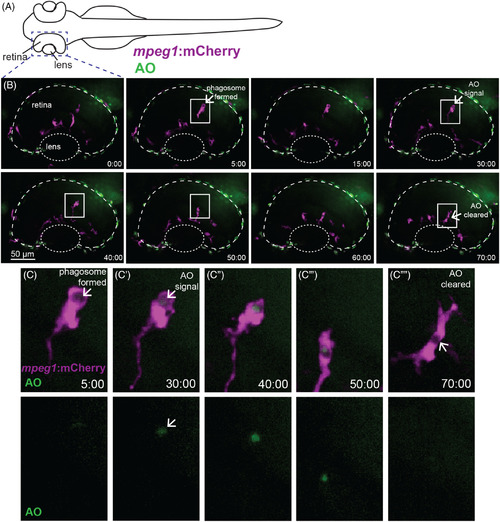
Real‐time imaging and direct observation of apoptotic cell clearance by microglia during retinal development. A, Diagram of embryonic zebrafish as positioned for live imaging, indicating the developing eye/retina and region subjected to imaging. At the time of imaging, the developing zebrafish eye consists nearly entirely of the lens and retina. Retinas of mpeg1 :mCherry embryos (to label microglia, magenta) beginning at ~54 hours postfertilization (hpf) were imaged live using confocal microscopy. Acridine orange (AO, green) was used to label apoptotic cells in vivo. Images were acquired every 5 minutes, with z stacks spanning the entire retina, for 8 hours total (ending at ~62 hpf). B, shows selected, flattened z projections and selected time‐frames from a representative imaging session. Time stamps (minute:second) are shown at bottom right of each panel, with time 0:00 at the start of the selected frames. C–C′′′′ are enlarged insets of selected regions in B outlined by white boxes, showing mpeg1 :mCherry and AO merged (top row) and AO alone (bottom row). In B and C, a phagosome is formed (arrow in second panel of B, arrow in C) ~25 minutes prior to AO signal detection inside of the phagosome (arrow in fourth panel of B, arrow in C′ top and bottom). Clearance of the AO signal occurs ~40 minutes later (arrow, final panel of B and arrow in C′′′′). Initial AO signal detection was most frequently observed already associated with mpeg1 :mCherry cells (see Figure 4C) |