
Figure 7
- ID
- ZDB-FIG-200529-7
- Publication
- Parakh et al., 2020 - The Redox Activity of Protein Disulfide Isomerase Inhibits ALS Phenotypes in Cellular and Zebrafish Models
- Other Figures
- All Figure Page
- Back to All Figure Page
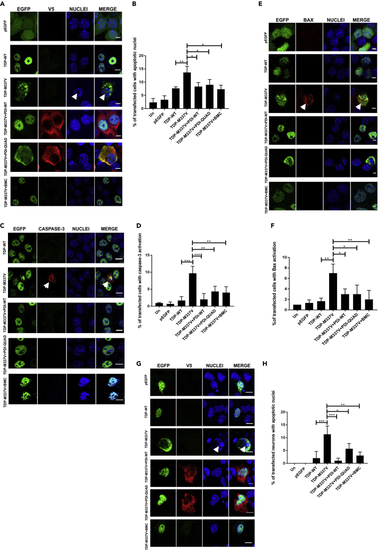
The Oxidoreductase and Chaperone Activities of PDI Are Protective against Mutant TDP-43 Induced Cell Death (A) Cells expressing EGFP (row 1), TDP-WT (row 2) or TDP-M337V (row 3), co-expressing PDI-WT or PDI-QUAD or BMC treated (rows 4, 5, 6), arrows represent apoptotic nuclei. (B) Over-expression of PDI-WT, PDI-QUAD, or BMC treatment with TDP-M337V resulted in significantly fewer cells with apoptotic nuclei compared with cells transfected with empty vector (∗p < 0.05). A significant difference was observed between TDP-WT and TDP-M337V expressing cells (∗∗p<0.01). (C) Immunocytochemistry using activated caspase-3 antibodies (red). Cells expressing TDP-WT (row 1) or TDP-M337V (row 2, arrows representing caspase-3 activation), co-expressing PDI-WT or PDI-QUAD, or treated with BMC (rows 3, 4, 5). (D) Over-expression of PDI-WT (∗∗∗p < 0.001), PDI-QUAD or treatment with BMC (∗∗p < 0.01), significantly decreased the proportion of cells with activated caspase-3. (E) Immunocytochemistry using anti-activated Bax antibodies (red). Cells expressing pEGFP (row 1), TDP-WT (row 2), or TDP-M337V (row 3, arrows representing Bax activation), co-expressing PDI-WT or PDI-QUAD, or treated with BMC (rows 4, 5, 6). (F) Over-expression of either PDI-WT or PDI-QUAD (∗p < 0.05), or treatment with BMC (∗∗p < 0.01), significantly decreased the proportion of cells with activated Bax compared with cells expressing empty vector. (G) Primary neurons expressing EGFP (row 1), TDP-WT (row 2) or TDP-M337V (row 3), co-expressing PDI-WT, PDI-QUAD, or treated with BMC (rows 4, 5, 6), arrows represent apoptotic nuclei. (H) Mutant TDP-M337V expression induced apoptosis (∗∗∗p < 0.001); however, over-expression of PDI-WT (∗∗∗p < 0.001), PDI-QUAD (∗p < 0.05) or administration of BMC (∗∗p < 0.01) resulted in significantly fewer neurons undergoing apoptosis. Scale bars: 8 μm in (A), (G), 10 μm in (C), 4 μm in (E). |