
Fig. 5
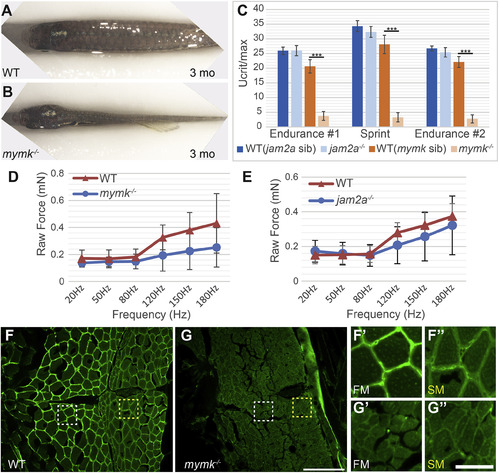
Muscle performance is severely compromised in adult mymk mutants. (A, B) Dorsal view of wild-type (WT) (A) and mymk mutant (B) adult fish showing the difference in muscle size. jam2a individuals are indistinguishable from wild-type (Shi et al., 2018; Zhang and Roy, 2017; and data not shown). (C) Swim tunnel performance of adult fish (3–6 months) reveals a dramatic difference in endurance and sprint capacity of mymk mutant and wild-type siblings (n = 5 each) but no difference between jam2a mutant and wild-type siblings (n = 6 each). (D, E) Assays of raw contractile force in stimulated 3 dpf mymk mutant and sibling control larvae (D) (n = 3–10 tested per frequency) and jam2a mutant and sibling control larvae (E) (n = 4 WT and n = 6 jam2a mutant embryos tested per frequency) indicate no significant force difference among comparable genotypes. At higher frequencies, muscle-specific force trends lower in both mutants but the difference is not statistically significant. (F-G″) Transverse sections of adult WT (F-F″) and mymk mutants (G-G″), near the horizontal myoseptum, immunolabeled to detect Laminin (green). Magnified views of boxed regions in F and G show fast muscle (FM; white box) (F′ and G′) and slow muscle (SM; yellow box) (F″ and G″) regions of WT and mymk mutant individuals respectively. Scale bar in G (for F and G) is 100 μm and scale bar in G’’ (for F′-G″) is 25 μm. Student’s t-test, p∗∗∗ <0.001. |
| Fish: | |
|---|---|
| Observed In: | |
| Stage: | Adult |
Reprinted from Developmental Biology, 462(1), Hromowyk, K.J., Talbot, J.C., Martin, B.L., Janssen, P.M.L., Amacher, S.L., Cell fusion is differentially regulated in zebrafish post-embryonic slow and fast muscle, 85-100, Copyright (2020) with permission from Elsevier. Full text @ Dev. Biol.